Join Our Telegram channel to stay up to date on breaking news coverage
Terra Classic (LUNC) Price Prediction – June 9
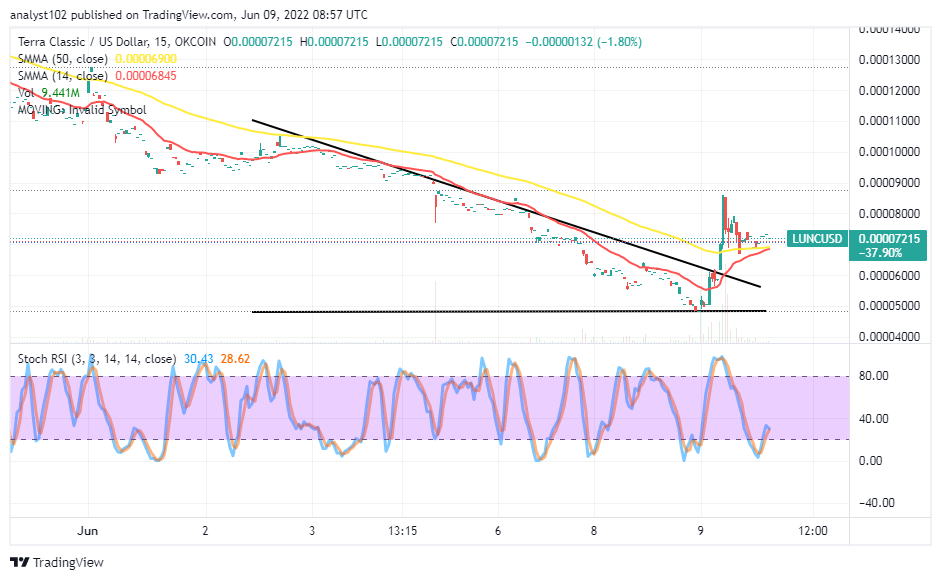
The last couple of hours showcases a new directional movement in the LUNC/USD market operations as the trending crypto attempts to swing northward against the American currency.. Price is currently trading around the $0.00007215 with a less minimal percentage value.
Terra Classic (LUNC) Price Statistics:
LUNC price now – $0.00007148
LUNC market cap – $466.5 million
LUNC circulating supply – 6.5 trillion
LUNC total supply – 6.9 trillion
Coinmarketcap ranking – #216
LUNC/USD Market
Key Levels:
Resistance levels: $0.00009, $0.00010, $0.00011
Support levels: $0.00005, $0.00004, $0.00003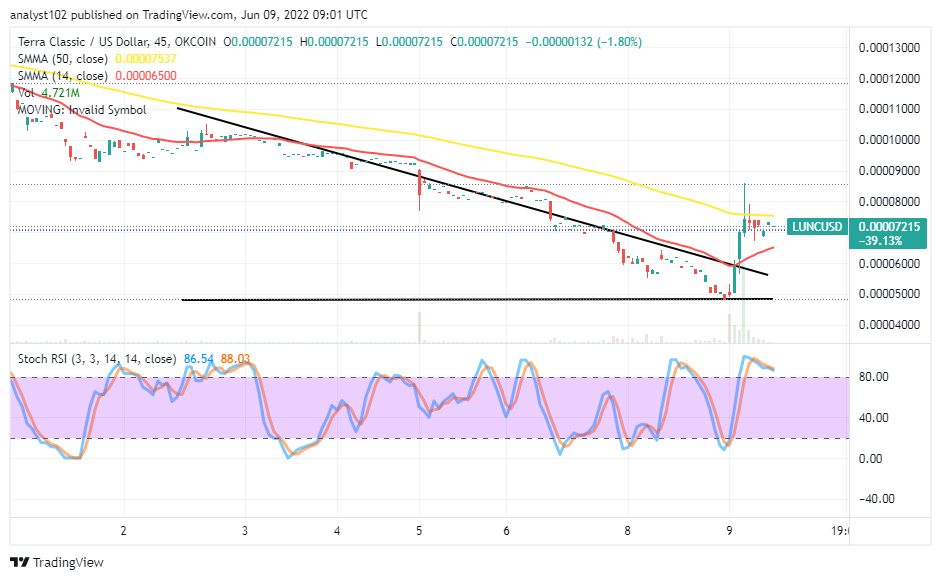
The LUNC/USD long-term chart reveals the crypto market attempts to swing northward after downsizing to the tune of $0.00005 during yesterday’s sessions as it eventually finds support around it in the early hours of today. The 14-day SMA indicator has bent toward the upward direction beneath the 50-day SMA. The horizontal line drawn at the $0.00005 support level acts as a critical point against getting a new round of downs. The stochastic Oscillators are in the overbought region to show price has reached a point to relax its activeness for a while.
Will there be more upswings in the LUNC/USD market over the trading SMA indicators?
It may be difficult for the LUNC/USD market bulls to forcefully push above the trading SMA indicators based on the outlook of an overbought reading condition as the crypto attempts to swing northward. Some trading candlesticks have featured at a high-trading spot in the form of convergence to portend a tough time awaiting any further upward motion around the zone from that trading gravity capacity. It would be ideal to allow a pull-down off from the convergence zone aligning with the reading of the Stochastic Oscillator, given a lower range position coupling with an active rebounding motion before launching a long order afterward.
On the downside of the technical analysis, selling positions seem to have taken place at the second formation of a bearish candlestick while the price averaged the $0.00009 resistance point t. Bears needed to have launched a sell order around the trend line of the 50-day SMA for an early entry position. They also have to protect their orders by using a stop-loss order. On the contrary, the present trading point provides one of the best buying times for investors to consider joining. Even if the market goes down further should attract more buying orders or additions.
LUNC/USD Medium Chart
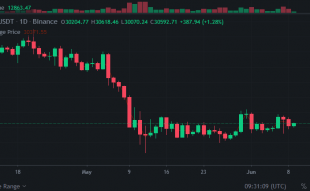
The LUNC/USD medium-term chart reveals the crypto attempts to swing northward. A chain of candlesticks has converged over the trend lines of the SMAs. And most of the candlesticks featured bearish outlooks. The 14-day SMA has touched the 50-day SMA indicator from underneath. The Stochastic Oscillators are in the 40 and 20 range lines, trying to close their lines within. The points between $0.00005 and $0.00007 may serve as the buying spots in the near time.
Read more:
Join Our Telegram channel to stay up to date on breaking news coverage
