Join Our Telegram channel to stay up to date on breaking news coverage
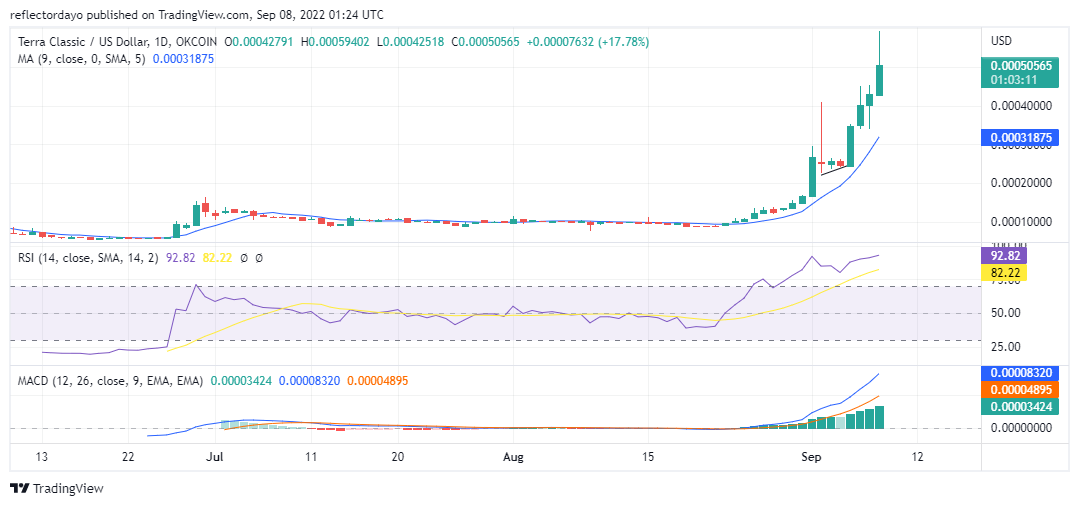
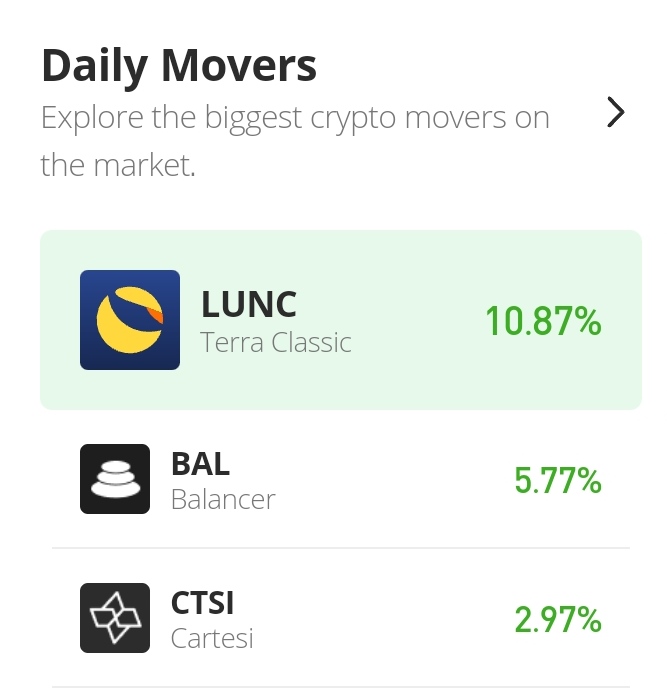
Against all expectations that (having come into the overbought region) the price of LUNC/USD should retrace a downward level, the altcoin kept shooting up with very strong pressure from the buyers. Within two days Terra Classic has broken another price level. And so far in the day’s trading session, the candlestick shows the vigour of buyers in the market. They have kept the market trading in one direction (that is the bull’s direction). The altcoin has defiled sentimental expectations as it has kept on the bullish momentum for four days. On the 5th day of September, the candle that represents the trade for that day was a marubozu. A marubozu signifies a very bullish market. After breaking the $0.00040000 resistance level yesterday, it has also broken the $0.00050000 resistance level in today’s market. And at the present, the price is $0.00052905.
Terra Classic Market Price Statistic:
- LUNC /USD price now: $0.00052905
- LUNC /USD market cap: $ 3,307,574,658
- LUNC /USD circulating supply: 6,151,000,000
- LUNC /USD total supply: 6,904,017,889,662
- LUNC /USD coin market ranking: #26
Key Levels
- Resistance: $0.0006000, $0.0006500, $0.0007000
- Support: $ 0.0004000 $0.0003500 $0.0003000
Your capital is at risk
Terra Classic Market Price Analysis: The Indicators’ Point of View
From the outlook of Moving Average Convergence and Divergence, the histograms show strong bullish activities in the market. the difference between the value of the histogram and the fastest line is about 42%. This is showing how strong the bullish momentum is. Also in the Relative Strength Index, both the RSI line and the Signal line are in the overbought zone for quite a while. RSI line measures 93% while the signal line measures 82%.
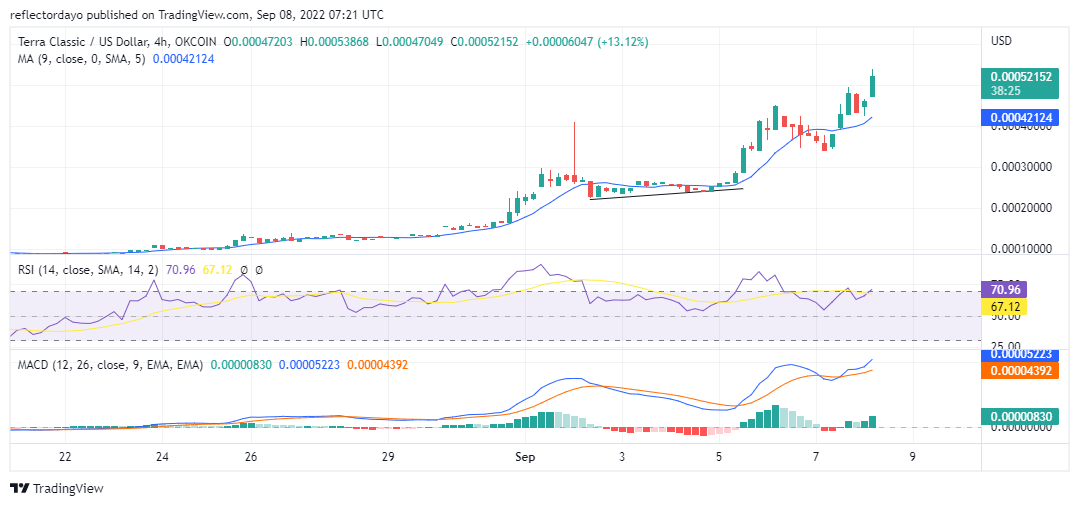
Terra Classic: LUNC/USD 4-Hour Chart Outlook
In the RSI of this timeframe, the altcoin had several price corrections from the overbought. These price retracements were so brief that it did not reflect in the daily chart. According to the RSI, the signal line has not entered the overbought. It
measures 66.8%. That is just an indication of a bullish market. I think this market will soon break the $0.00060000 resistance level.
Related
Join Our Telegram channel to stay up to date on breaking news coverage