Join Our Telegram channel to stay up to date on breaking news coverage
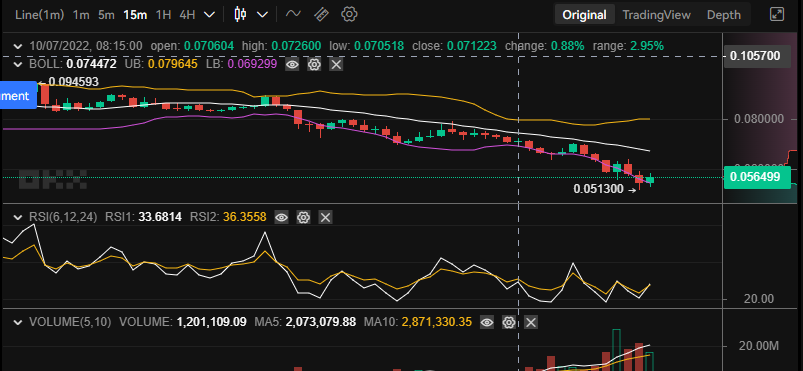
In the second hour of today’s trading session, sellers responded equally to the bullish move. And after that time, sellers took control of the Tamadoge market and the price finds its direction to the downside. But towards the end of the fifth hour, buyers began to recover their ground in the market and the price of TAMA began to rise.
Tamadoge Market Price Statistic:
- TAMA/USD price now: $0.0557
- TAMA/USD market cap: $113,830,660
- TAMA/USD circulating supply:1.01Billion
- TAMA/USD total supply: 1,049,733,333
- TAMA/USD coin market ranking: #2647
Key Levels
Resistance: $0.1197, $0.12000, $0.1400
Support: $0.1084, $0.0900, $0.0800
Tamadoge Market Price Analysis: The Indicators’ Point of View
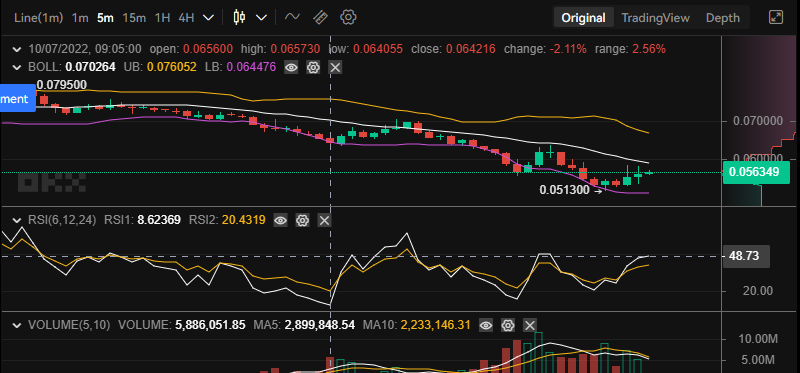
Buyers could not hold on to their victory for long as they soon lose ground to the sellers again. However, the bearish move along the chart is filled with lots of doji candlestick patterns. The implication of this is that the bearish trend will not last, and as we can see, the Buyers are resilient. According to the Bollinger band indicator, the price actions are now moving through the lower band of the indicator. They are moving at the threshold of the oversold region, the bearish trend is nearing an end. The widening bands of the indicator tell us that the pressure on the market is increasing on both sides and the buyers will have the upper hand.

Tamadoge: TAMA/USD 5-Minute Chart Outlook
The Tamadoge market, from this point of view, has started its bullish price journey as the price action is taking off from the lower bands of the indicator. It seeks to breakthrough up above the basis line of the Bollinger. Times like this offer investors opportunity to buy and hold the crypto for a profitable return.
Join Our Telegram channel to stay up to date on breaking news coverage


