Join Our Telegram channel to stay up to date on breaking news coverage
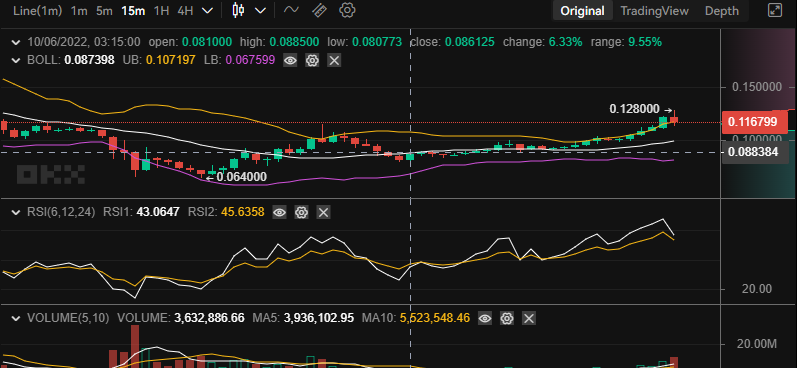
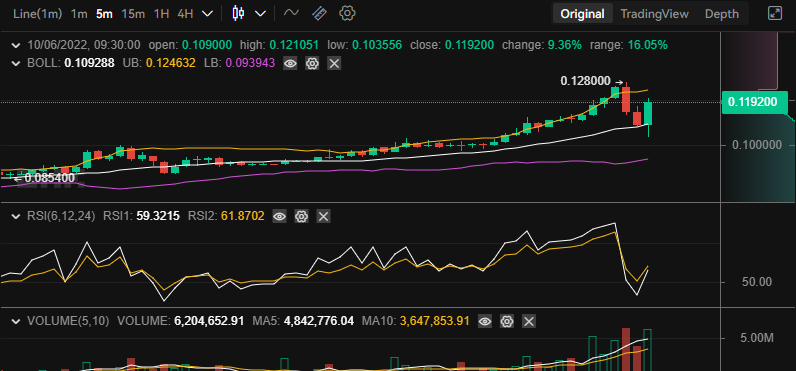
In yesterday’s Tamadoge market, as the buying pressure increased, the price reached $0.1829. And at that height, traders began to sell to take in their profits. They kept selling into today’s market session. This brought the market into the oversold region. And from the low of $0.1037 in today’s market, the price begins to rise as investors are buying again.
Tamadoge Market Price Statistic:
- TAMA/USD price now: $0.1192
- TAMA/USD market cap: $113,830,660
- TAMA/USD circulating supply:1.01Billion
- TAMA/USD total supply: 1,049,733,333
- TAMA/USD coin market ranking: #2647
Key Levels
Resistance: $0.1197, $0.12000, $0.1400
Support: $0.1084, $0.0900, $0.0800
Tamadoge Market Price Analysis: The Indicators’ Point of View
As the price of the market retraces lower levels, the Relative Strength Index line rebounds from the overbought to settle at 46% market strength which is slightly below the indicator’s bullish market zone. At this point, bulls and bears are contending for control of the market, and as a result, the price of TAMA lingers around the current price.
Tamadoge: TAMA/USD 5-Minute Chart Outlook
In the Bollinger band indicator, the TAMA price action has moved below the basis line. When price action moves below the basis line and gets close to the lower band of the Bollinger band, traders should prepare themselves to buy because the market is preparing for another upside performance. Traders should watch for the point at which the RSI line crosses the signal line and they should place their trade.
Join Our Telegram channel to stay up to date on breaking news coverage


