
Join Our Telegram channel to stay up to date on breaking news coverage
xSynthetix (SNX) Price Prediction – May 30
There have been lowering-highs-and-lows operations in the SNX/USD market for a long time. The SNX price is in a sideways trading pattern, showcasing the rate of the market’s percentage at 6.10 positives.
Synthetix (SNX) Price Statistics:
SNX price now – $2.55
SNX market cap – $348.8 million
SNX circulating supply – 19.1 trillion 114,841,533
SNX total supply – 18.9 trillion 215,258,834 SNX
Coinmarketcap ranking – #106
SNX/USD Market
Key Levels:
Resistance levels: $4, $5, $6
Support levels: $2.50, $2, $1.50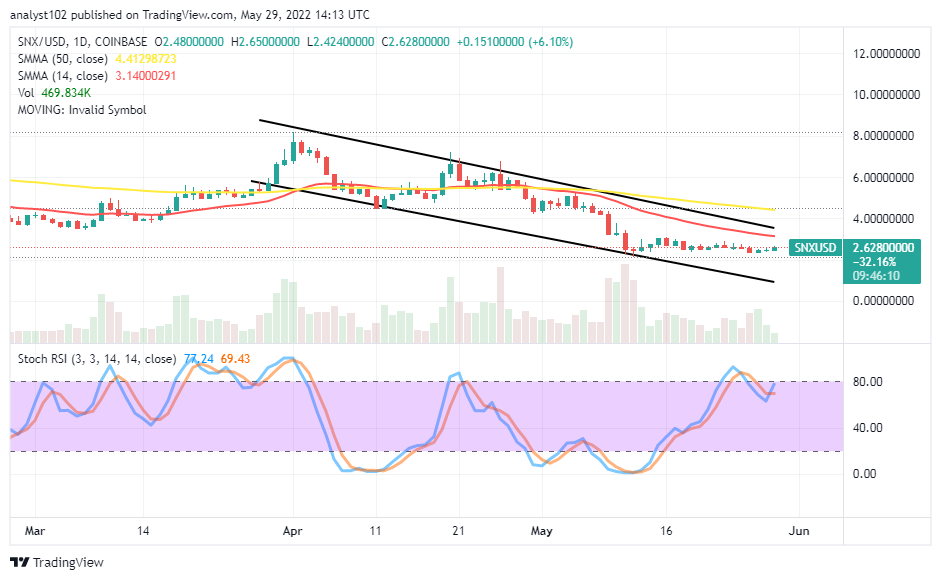 SNX/USD – Daily Chart
The daily chart showcases the SNX market operation is in a sideways-trading pattern against the valuation of the US Dollar. The 14-day SMA indicator is above the 50-day SMA indicator. The upper bearish channel trend line drew closely over the smaller SMA. The 50-day SMA trend line is above the 14-day SMA trend line. The Stochastic Oscillators have moved northbound against range lines to now move in a consolidation style around the range of 80, covering some spaces in the overbought region near above it.
Will the SNX/USD trade moves firmly to gain more points away from the smaller SMA?
It is not apparent that the SNX/USD market buyers will intensify efforts to gain profits away from the smaller SMA trend line soon. In the meantime, there can be low-active motions to the upside. And that could lead to finding resistance around the 14-day SMA to signify an end to getting more ups of any length thereof. Long-position takers needed to wait for a correction to emerge with the help of the Stochastic Oscillators’ reading that tends to suggest a downward-trending situation before considering buying back into the crypto economy.
On the downside of the technical analysis, the SNX/USD trading outlook appears to soon run into a resistant-trading condition around the SMAs. A sudden spike against the 14-day SMA indicator has to encounter resistance around the upper 50-day SMA indicator to allow bears the dominance priority to resume their bearish-trending movement of the crypto trade. A pull-up has to surface at a higher point to get rejected immediately to allow bears the opportunity to detect a decent-selling order.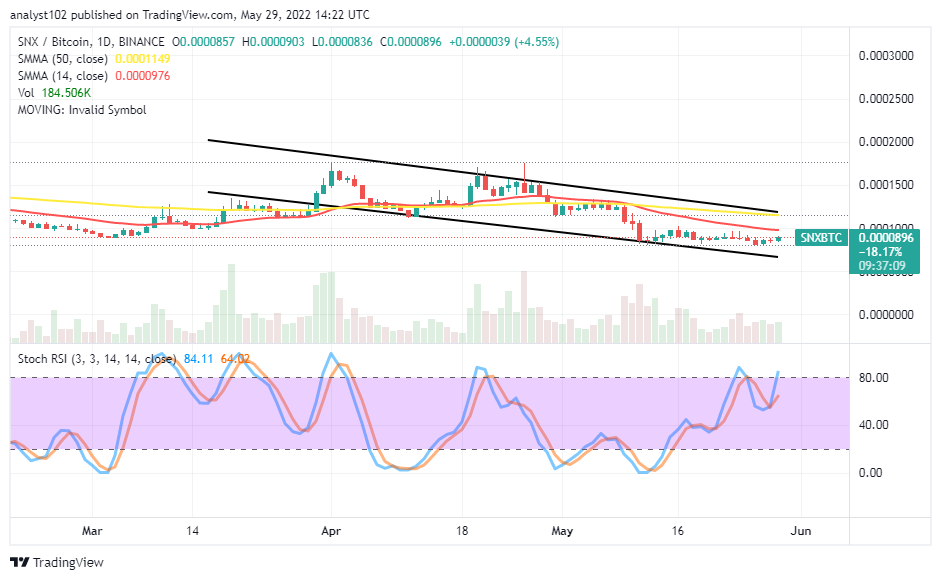
SNX/BTC Price Analysis
Comparing the trending power of Synthetix with that of Bitcoin, the price analysis chart reveals the base trading instrument has been debasing against the counter trading tool. The cryptocurrency pair price is in a sideways trading pattern below the trend line of the smaller SMA. The 50-day SMA indicator is above the 14-day SMA indicator. The Stochastic Oscillators have zigzagged northbound against variant range lines to denote the base crypto’s effort to push for recovery has not been fruitful as smaller candlesticks form almost in a row to the east direction. That shows the falling force from the end of the counter crypto may not stop soon.
Read more:
Join Our Telegram channel to stay up to date on breaking news coverage