Join Our Telegram channel to stay up to date on breaking news coverage
Stellar (XLM) Price Analysis – May 10
As the selling momentum nears an end, there’s a need for a huge buying momentum to walk up the bull for a positive move. XLM market, however, appeared to further trend in a bearish. As of the time of writing, there is no yet sign for an upward move
XLM/USD Market
Key Levels:
Resistance levels: $0.1, $0.11
Support levels: $0.085, $0.08
After witnessing a price increase, the XLM price has dropped significantly over the past four months of trading due to the selling control in the market. As a result of this, the bears have gained control of the market. There’s a tendency for more drops as trading volatility decreases.
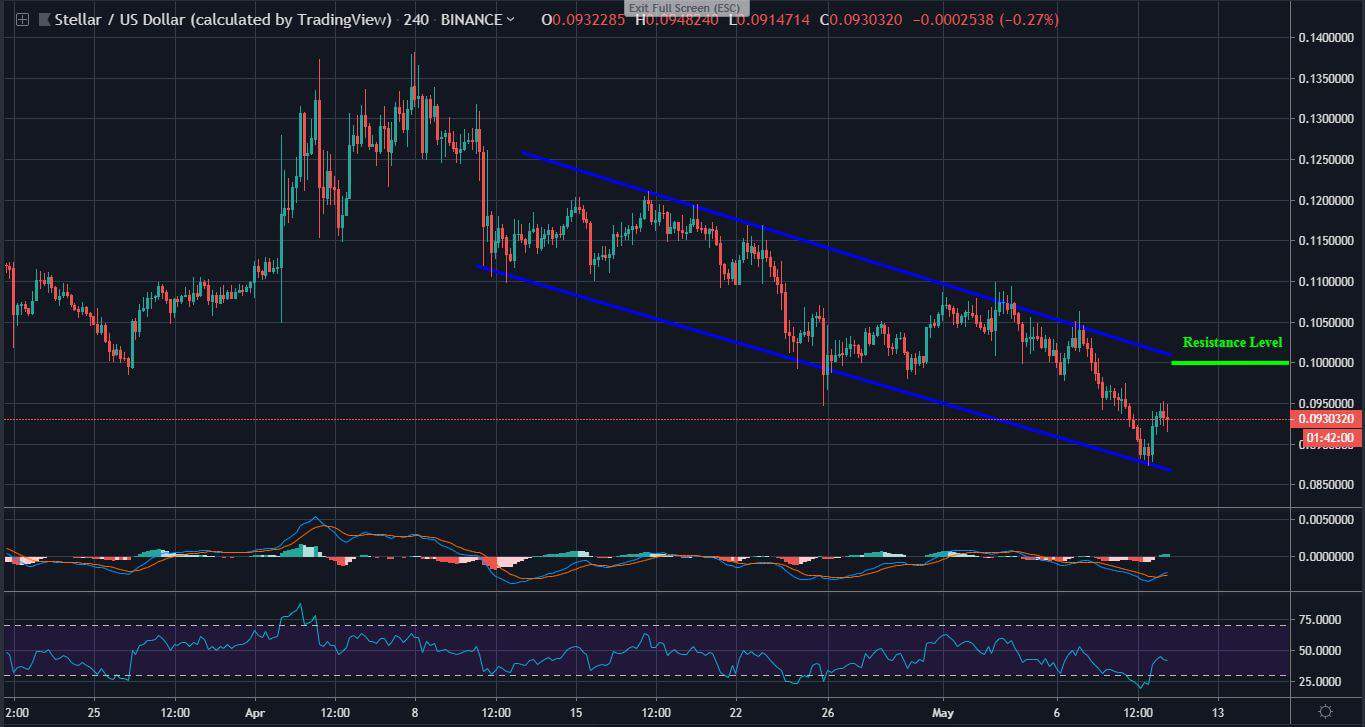
Following the trend, the next selling pressure is likely to hit the $0.85 support level and beyond. On a high move, the buyers may meet resistance at $0.1 level, where the trend line lies. Rising above the mentioned resistance may shoot the market in an upward movement.
The 4-hours MACD is revealed at the negative level. Dropping lower may further rally the token in another bearish. As shown on the 4-hours RSI, the trend is testing the 42 level of the indicator.
XLM/BTC Market
Significantly, a strong bearish dominance is revealed for the XLM market. The long decline move is still intact in the channel. As the bears continue to gain momentum, Stellar price falls and the market furthers establish a new low. Before the bearish rally continues, the bidders could retrace to 1600SAT resistance.
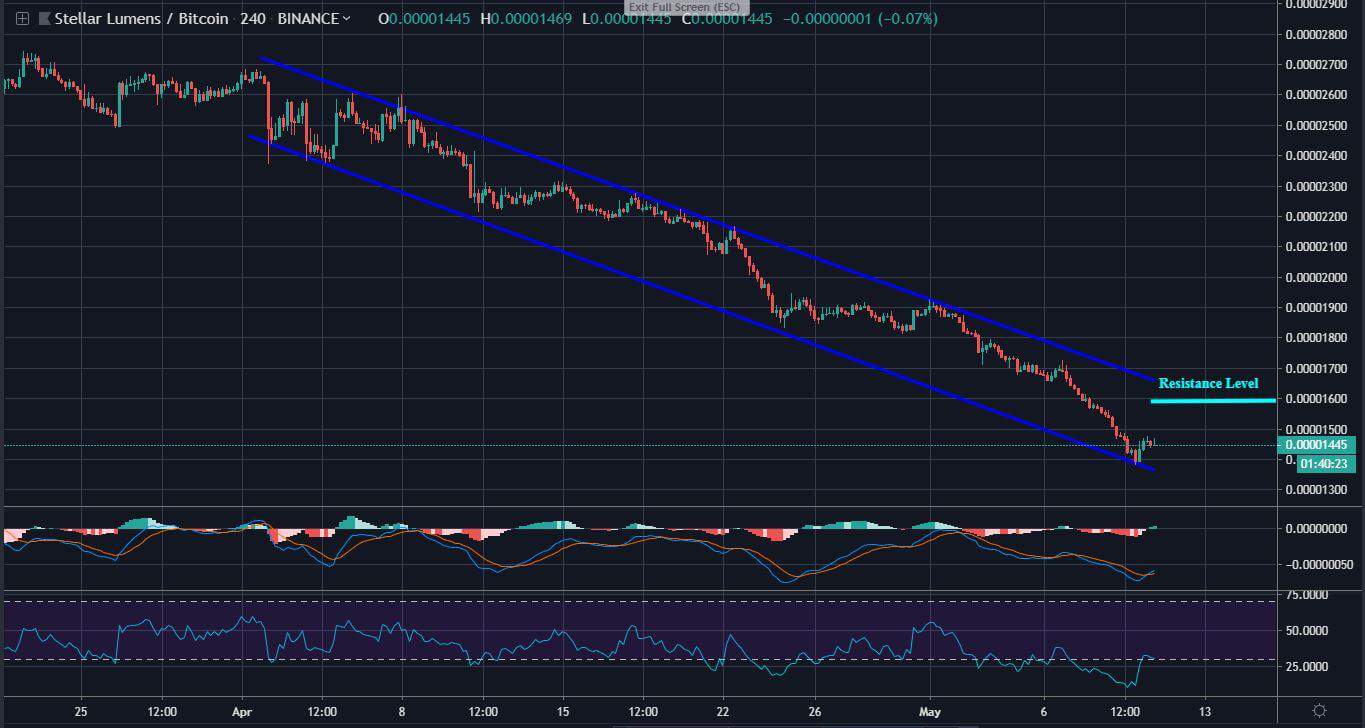
Since the market fell in April, the 4-hours MACD has been trending in the negative zone. This shows that Stellar is following a strong bear sentiment. The next support level for the bear could be located at 1300SAT. If price breaks up the 1600SAT after a retest, the trend may follow a positive move.
However, the 4-hours RSI has been operating below the 55 level for the past a month now. At the moment, there’s a need for a rise above the 50 level to begin a bullish move.
Please note: insidebitcoins.com is not a financial advisor. Do your own research before investing your funds in any financial asset or presented product or event. We are not responsible for your investing results
Join Our Telegram channel to stay up to date on breaking news coverage