Join Our Telegram channel to stay up to date on breaking news coverage
Ethereum (ETH) Price Analysis – April 25
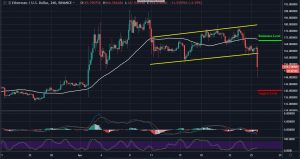
Having broken out of the channel, Ethereum markets follows a downward movement. The sellers are back in the market as they appeared to position both ETHBTC and ETHUSD in a more bearish condition. Meanwhile, the market had loss of 6% in the last 24-hours of trading. More bleeding should be expected!
ETH/USD Market
Key Levels:
Resistance levels: $170, $180
Support levels: $140, $130
When you Buy Bitcoin with PayPal and the price drops, altcoins drop twice as much as the leading currency. Ethereum, which maintained a rising channel had just broke-down now; this signals a bearish move for the token. The selling pressure is likely to find a bottom at $140 support level.
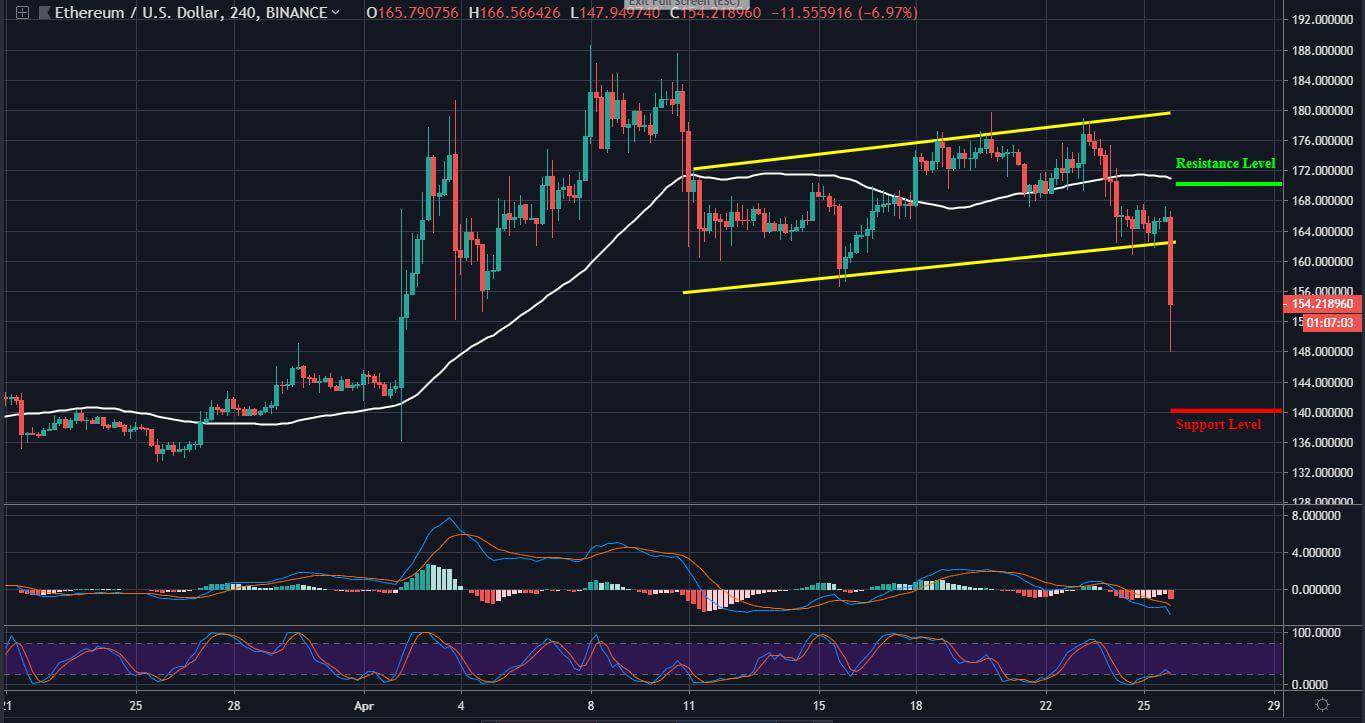
Meanwhile, a close-by resistance may be spotted at $170 level. Apparently, the important 50-day moving average (white line) trends above the market which signals a bearish control. in the next few days of trading, the direction of the white line would determine the strength of the market.
Considering the 4-hours MACD, ETH is now trading at the bearish zone. More falls are expected in future trading. As of the time of writing, ETH/USD market is trending at the 20 level of the 4-hours Stochastic RSI.
ETH/BTC Market
Breaking out of the falling channel, ETHBTC market continued to follow a bearish sentiment. The bearish move was significant on the medium-term MACD as it currently plays at the extreme low. This shows that the sellers are strongly in control of this market.
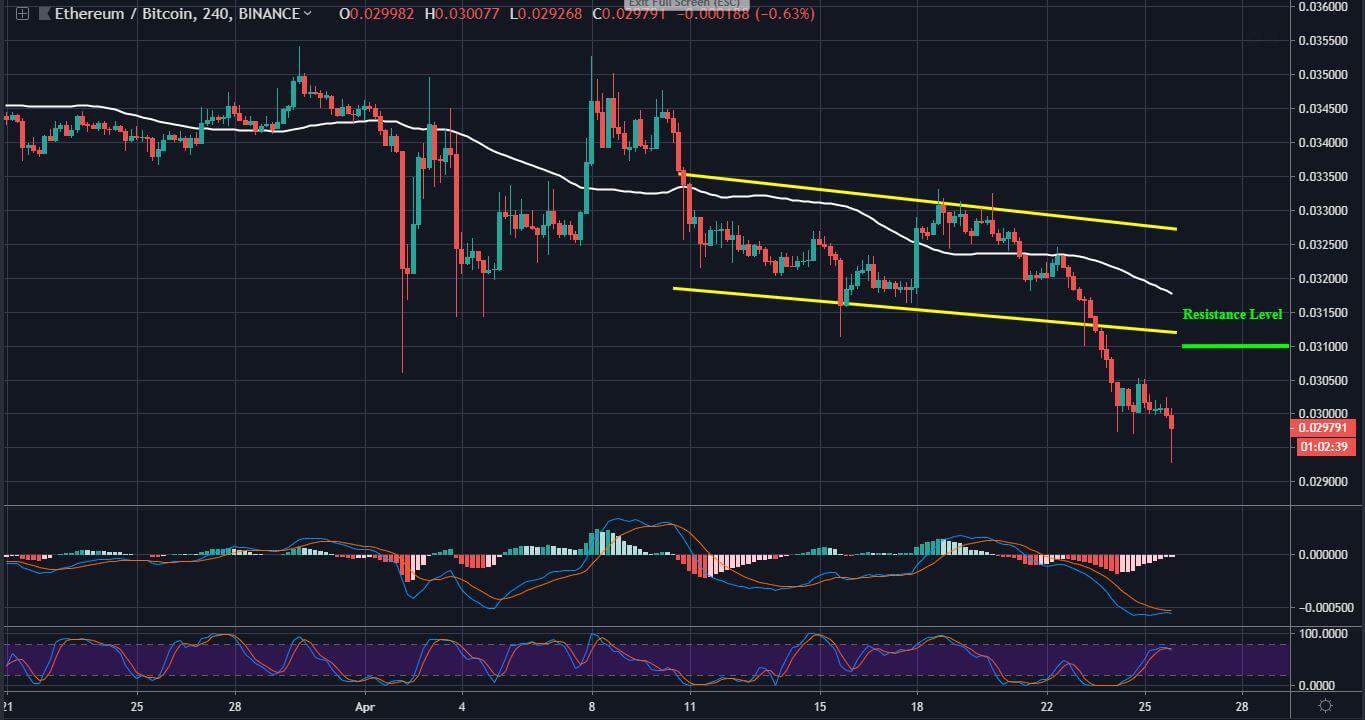
Since yesterday, this pair has been consolidating; waiting for the next direction which is yet unknown. If cryptocurrency exchanges stays positive, the buyers may drive the price to the 0.031BTC resistance level. On the other hand, a negative move could further the bearish rally to 0.029BTC low and beyond.
Looking at the chart, the price action is far below the 50-day moving average (white line); suggesting a strong selling pressure. Picturing the 4-hours Stochastic RSI, a possible sell could send price to the oversold condition.
Please note: insidebitcoins.com is not a financial advisor. Do your own research before investing your funds in any financial asset or presented product or event. We are not responsible for your investing results.
Join Our Telegram channel to stay up to date on breaking news coverage