Join Our Telegram channel to stay up to date on breaking news coverage
XLM Price Analysis – September 6
After the last few days of price movement, the bulls suffered a serious downtrend, with a new downtrend playing on the daily chart.
XLM/USD Market
Key Levels:
Supply levels: $0.070, $0.75, $0.080
Demand levels: $0.050, $0.045, $0.040
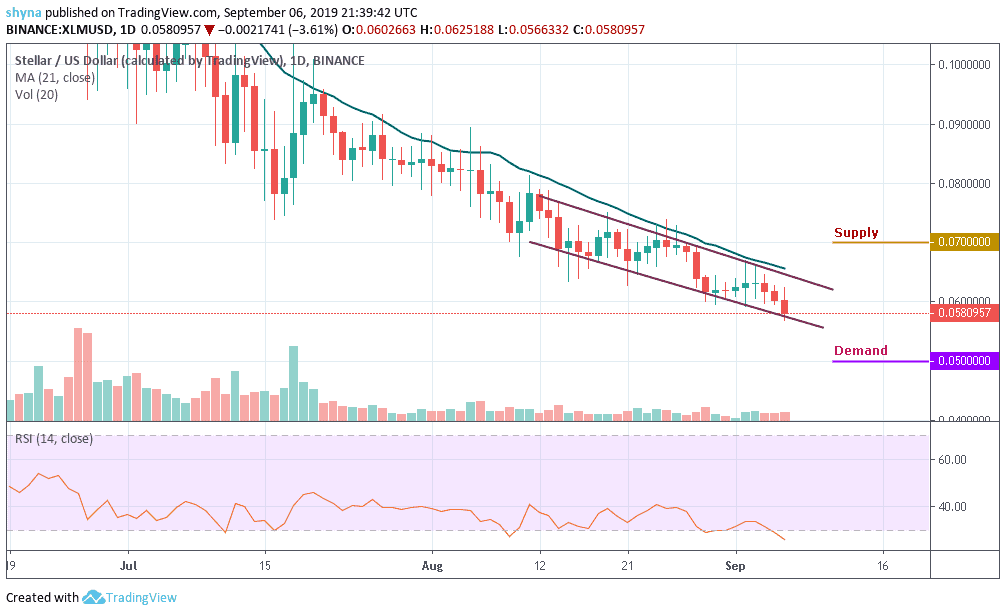
Stellar (XLM) price is indicating downtrend in the market moving below 21-day MA. The coin is bitten by the bear and once again the expectations of upsurge are ruined. We were quite apprehensive about the progression of the coin, but it looks like the coin would take time to improve. The coin is slipping in the crypto chart in terms of rank.
However, as the Stellar price remains jerky, we await the possible direction of XLM. For a positive peak, the $0.070, $0.075 and $0.080 are the main supply levels for the coin at the moment. Looking at the volume of the chart, we can see the XLM at its lowest. As a result, a negative spike would test significant demand at $0.050 and $0.045 before a slippage of $0.040. More so, XLM/USD is bearish in the long run as RSI (14) is currently at the oversold territory, which indicates the bulls may surface soon.
XLM/BTC Market
Comparing with Bitcoin, the pair has eventually broken another solid support at the 560 SAT. Stellar price may likely see another sharp drop at 550 SAT support level. Breaking this level could further drag the market to the nearest support levels at 480 SAT, 470 SAT, and 460 SAT.
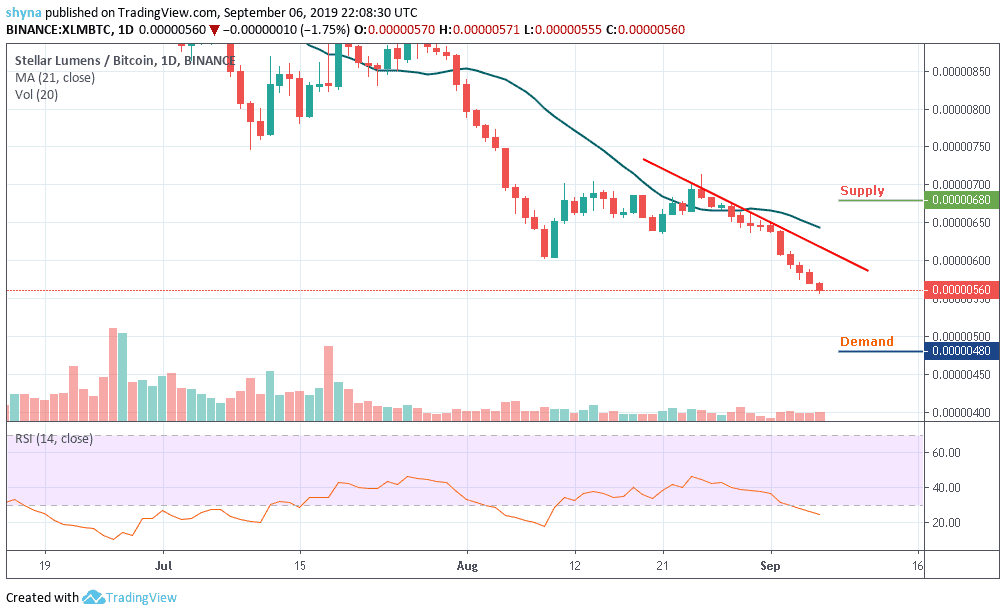
However, XLM is currently changing hands at 560 SAT and if the bulls can hold the price tight and push it upward, the next key targets price lies at 680 SAT and 690 SAT respectively. Reaching these levels might move it to 700 SAT level. Meanwhile, RSI (14) is now lying at the oversold zone, there might be bullish signals if turns upward.
Please note: Insidebitcoins.com is not a financial advisor. Do your own research before investing your funds in any financial asset or presented product or event. We are not responsible for your investing results.
Join Our Telegram channel to stay up to date on breaking news coverage