Join Our Telegram channel to stay up to date on breaking news coverage
SPX6900 price prediction is bullish as it trades at $0.0065. Though SPX is turning down on the four-hour chart, it is up more than 30% on the day and has rallied approximately 90% over the past week.
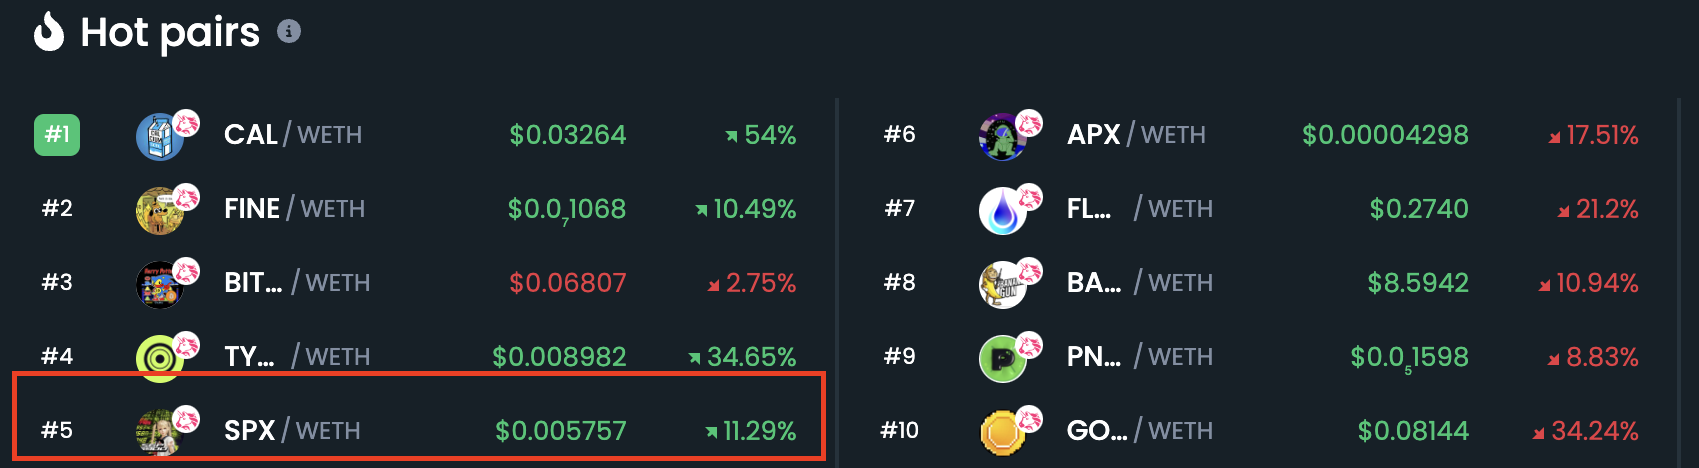
According to data from CoinMarketCap, the token’s 24-hour trading volume has jumped 90% to $669,541. As a result of this growing trading activity, SPX6900 ranks number five on the list of trending tokens on Dextools.io today.
This follows a strong rally initiated on Sept 21, causing the token to reclaim key support levels. If the current bullish recovery is sustained, technical indicators and a highly bullish technical formation point to a massive move for SPX.
SPX6900 Price Prediction and Technical Analysis
SPX price dropped approximately 67% from the equal highs of $0.0045 to set a swing low of around $0.001483. This was followed by a steady run-up to the current levels oaboutnd $0.005724.
This price action has led to a rounded bottom pattern on the four-hour chart, as shown below. This pattern appears when an asset initially descends toward a low, indicating an excess supply. A reversal to an upward trend occurs when buyers enter the market on the dips, which increases demand for the asset. Once the rounding bottom is complete, the asset breaks out to start a massive move upward.
In the case of the SPX6900 price, a breakout from the rounding bottom chart pattern occurred on Tuesday when the token produced an eight-hour candlestick close above the price immediately before the start of the initial decline (the neckline) – in this case, the $0.0045 mark.
This sets SPX on the path to a 49.5% increase to reach the bullish target of the prevailing chart pattern around $0.0075. This would constitute a 30% ascent from the current price.
SPX/USD Four-hour Chart
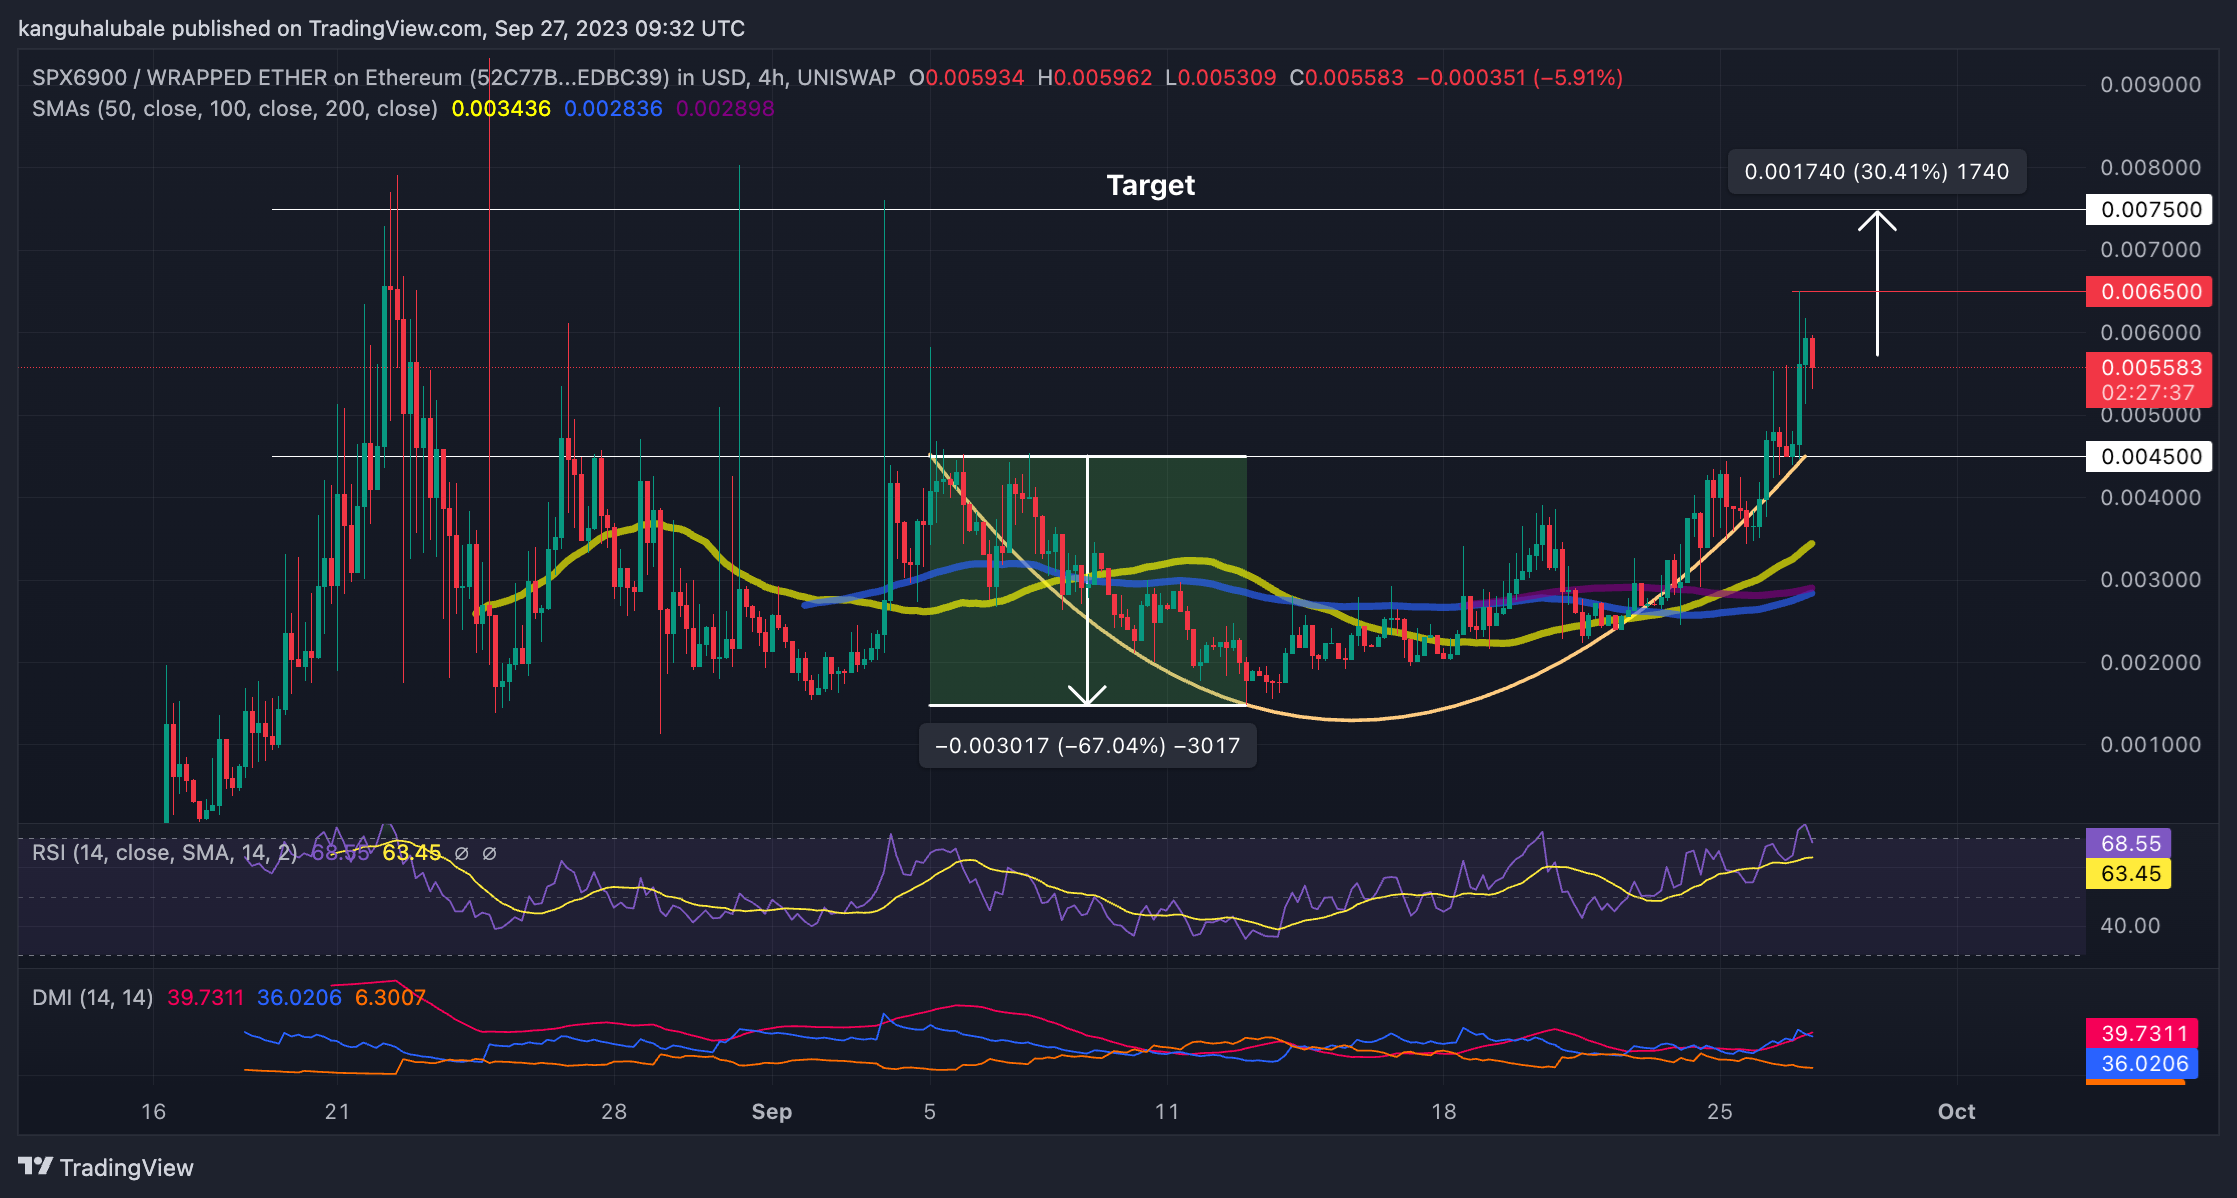
Apart from the significantly bullish chart pattern, the Direction Movement Index (DMI) showed that the buyer’s grip on SPX was still firm. The positive directional line (+D1) at 36 was way above the negative directional (-D1) line at 6.3. The Average Direction line (ADX) was 39, suggesting the uptrend was very strongThehe Relative Strength Index (RSI) waalso also positioned in the positive region. The price strength at 69 indicated that the buyers were in complete control of the price, adding credence to SPX’s positive outlook.
Moreover, the SPX6900 price traded above all the major moving averages, providing robust support on the downside. These areas were defined by the 50-four-hour Simple Moving Average (SMA) at $0.003436 and the $0.0028 region, embraced by the 100 and 200 SMAs.
Also, note that the SMA had sent a call to buy SPX on the same four-hour chart. This came in the form of a golden cross on Monday when the fast-moving 50 SMA crossed above the 200 SMA. This bullish cross still played, implying that the market conditions favored SPX’s upside.
Conversely, the crypto was turning down, as a red candlestick appeared on the four-hour chart. The RSI was facing down, suggesting that although there were more buyers than sellers in the market, their strength could soon run out as buyer fatigue kicked in. This implied that the ongoing price correction favoring the downside could continue quickly.
As such, a four-hour candlestick close below $0.0055, would invalidate the recovery efforts and extend the current sell-off, resulting in another correction toward the $0.0050 psychological level, or the chart’s neckline around $0.0045.
SPX Alternatives

Meme Kombat (MK), is a new meme coin set to become the market’s favorite from its inception. This project leverages the cutting-edge technology and the decentralized power of the Ethereum network to create a unique and engaging gaming experience.’
New Cryptocurrency Meme Kombat ($MK) Launches Public Token Presale, Staking Platform –
New crypto project ‘Meme Kombat’ has announced the presale of its native token is now live, in a September 21st tweet from its official X account @Meme_Kombat. $MK token is able to be pu… pic.twitter.com/eIeI6WlPK5— The Industry Spread (@industryspread) September 25, 2023
The team behind $MK launched the presale on Sept 21 and has already garnered more than $100,000 within just a week of its launch.
The $MK token is auctioning for $1.667 and can be bought from the Meme Kombat website using ETH, USDT, or on the Binance Smart Chain using BNB. Interested investors can use various crypto wallets, including MetaMask, Trust Wallet, CoinBase Wallet, OKX Wallet, and Ledger Live Wallet.
From the presale phase onward, $MK token holders can promptly engage in staking their tokens and receive an impressive annual percentage yield (APY) currently at 112%. This means that early investors stand to gain the most, as they can start earning from the outset and benefit from potential price increases.

Blending the features of stake-to-earn (S2E) and play-to-earn (P2E), Meme Kombat allows the player who emerges victorious in the battles to be rewarded with valuable prizes that investors eagerly anticipate. Payments are made instantly using blockchain technology, improving the overall gaming experience while ensuring transparency and security for all players.
These enticing features and captivating design guarantee the potential for a 10x return on investment, making it the next cryptocurrency to explode as opined by Crypto Gains in a YouTube review.
Visit Meme Kombat here for more details.
Related News
Best Wallet - Diversify Your Crypto Portfolio

- Easy to Use, Feature-Driven Crypto Wallet
- Get Early Access to Upcoming Token ICOs
- Multi-Chain, Multi-Wallet, Non-Custodial
- Now On App Store, Google Play
- Stake To Earn Native Token $BEST
- 250,000+ Monthly Active Users
Join Our Telegram channel to stay up to date on breaking news coverage