
Join Our Telegram channel to stay up to date on breaking news coverage
Solana Price Prediction – September 18
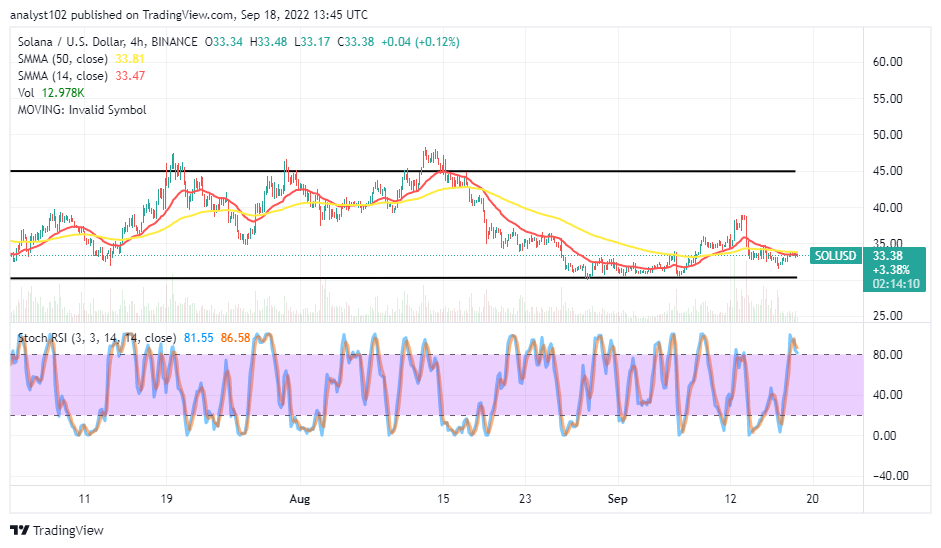
As of the time of writing, Solana market activity holds in a correction, trading against the valuation of the US Dollar toward a lower point at the $30 range line. The last seven days’ sessions have produced a low and a high of $31.64 and $38.87 value-lines. The trading percentage rate is at 1.07 negatives.
Solana (SOL) Statistics:
SOL price now – $33.37
SOL market cap – $11.8 billion
SOL circulating supply – 354..1 million
SOL total supply – 511.6 million
Coinmarketcap ranking – #9
SOL/USD Market
Key Levels:
Resistance levels: $40, $50, $60
Support levels: $25, $20, $15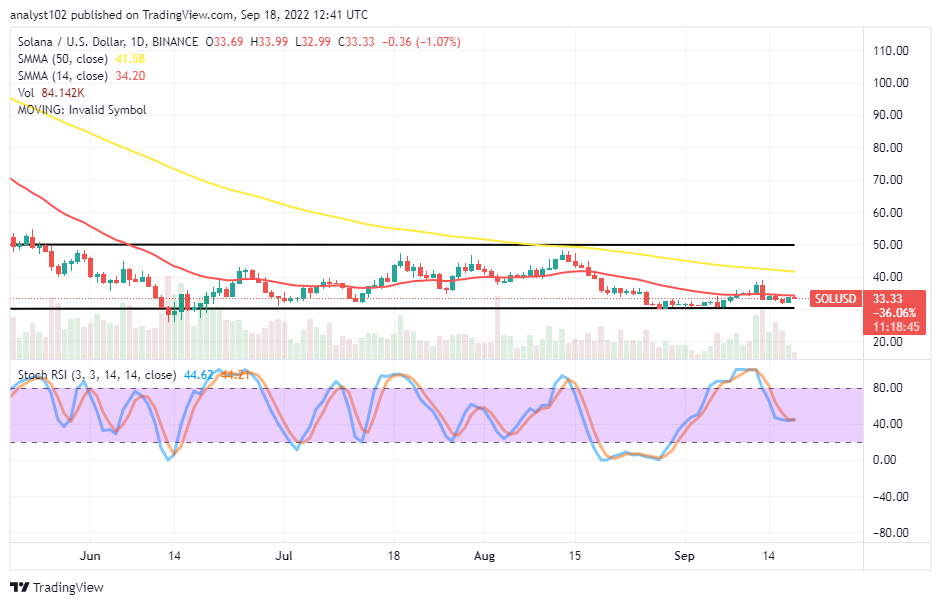 SOL/USD – Daily Chart
The daily chart depicts that Solana market activity holds in a correction against the market worth of the US Dollar over the lower range line at $30. The 14-day SMA indicator is at $34.20, underneath the 50-day SMA indicator, which is at $41.58. The upper range line remains drawn at the $50 resistance level. The Stochastic Oscillators are around 44.62 and 44.21 range values. Variant smaller candlesticks representing lows are liable to feature down to the lower range spot in the long run, as experienced previously.
Your capital is at risk.
Can the featuring of lower lows be decimated in no time as the SOL/USD price holds in a correction?
One or two bullish trading candlesticks will have to surface around or closely over the $30 range line to signal the possibility of decimating the featuring of lower lows in the SOL/USD market operation as price holds in a correction. Currently, there is a less-active motion to the south side closely beneath the sell signal side of the 14-day SMA trend line. Buyers now have to be alert of any possible rebound that can occur in no time alongside the moves before considering launching a buying order.
On the downside of the technical analysis, selling activities in the SOL/USD market have to hold firmly between the $40 resistance level and around the value line of the 14-day SMA trend line in the long run. At this point, the market still has about 44% capacity to push further to the downside if bulls are weaker at garnering energy between the tight space of the smaller-SMA trend line and around the lower range line at $30.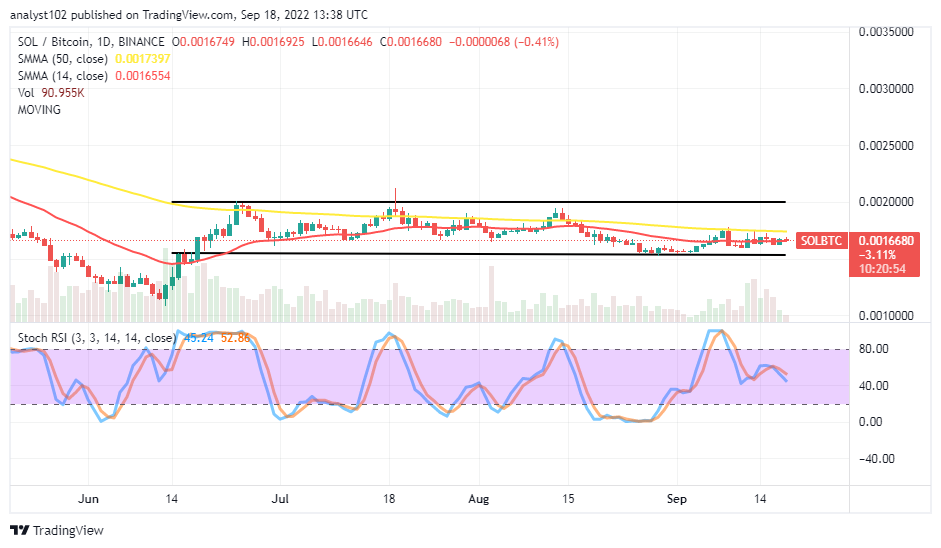 SOL/BTC Price Analysis
Solana market operation still trades around a high-trading range zone around the trend lines of the SMAs. The cryptocurrency pair market holds in a correction toward the lower range line. The 14-day SMA indicator is underneath the 50-day SMA indicator. The Stochastic Oscillators are above the range of 40. But they are now attempting to cross back southbound to 52.86 and 45.24 range values. It shows the base crypto can still lose its stance to find support at a lower-trading zone in the long-term run.
[In-content-heros name=”tamadoge-play-to-earn-meme-coin”]
Read more:
- How to buy Solana
- How to buy cryptocurrency
Join Our Telegram channel to stay up to date on breaking news coverage