Join Our Telegram channel to stay up to date on breaking news coverage
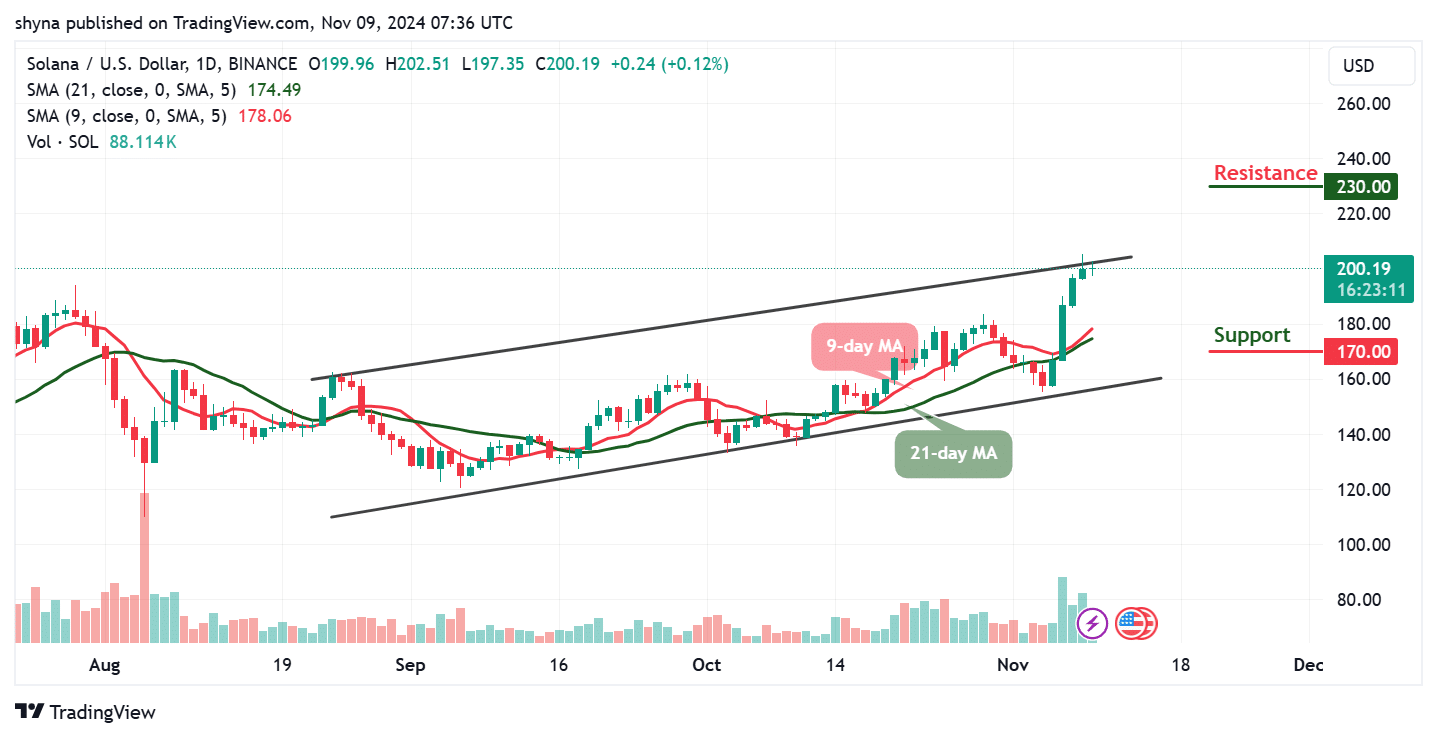
The Solana price prediction shows that SOL maintains a bullish movement and is currently trading around the $200.19 resistance level.
Solana Prediction Statistics Data:
- Solana price now – $200.19
- Solana market cap – $95.40 billion
- Solana circulating supply – 471.67 million
- Solana total supply – 588.09 million
- Solana Coinmarketcap ranking – #4
Solana (SOL) has demonstrated the potential rewards of early investment in crypto, with an extraordinary rise of 43,302.19% from its all-time low of $0.5052 in May 2020. Currently trading between $200.13 and $221.53, SOL reached an all-time high of $260.06 in November 2021, showing that even with recent fluctuations, early adopters have seen impressive returns. This performance highlights why getting in early on crypto projects can lead to significant gains.
SOL/USD Market
Key Levels:
Resistance levels: $230, $240, $250
Support levels: $170, $160, $150

SOL/USD has shown impressive upward momentum, with its price reaching the significant $202 mark. SOL’s rise through the $188 – $186 resistance range represents a breakout that has brought renewed bullish sentiment. This rally aligns with Solana’s strong fundamentals, which continue to attract interest and support investor confidence, especially with high Total Value Locked (TVL) and substantial decentralized exchange (DEX) trading volumes.
Solana Price Prediction: Would Solana Gain More Upsides?
As the daily chart reveals, the Solana price is trading above the 9-day and 21-day moving averages within the channel. On the upside, if the price breaks above the channel’s upper boundary and closes above it, SOL/USD may likely continue its uptrend and could reach resistance levels of $230, $240, and $250. Meanwhile, given the bullish fundamentals and current price action, the primary question is whether SOL can decisively break above the $220 level.
In the short term, Solana may continue to test resistance within the $210 – $215 range, with a possible advance toward $220. However, a pullback remains probable, especially if leverage unwinds or profit-taking occurs at these higher levels. The daily chart suggests that while Solana’s bullish momentum could push it to these resistance zones, a brief consolidation or correction could be expected, allowing the asset to gather strength before attempting another breakout. Meanwhile, if the technical indicator fails to cross above the 60-level, there is a tendency for the bears to return to the market, and this may likely cause the market price to hit the nearest support levels at $170, $160, and $150 respectively.
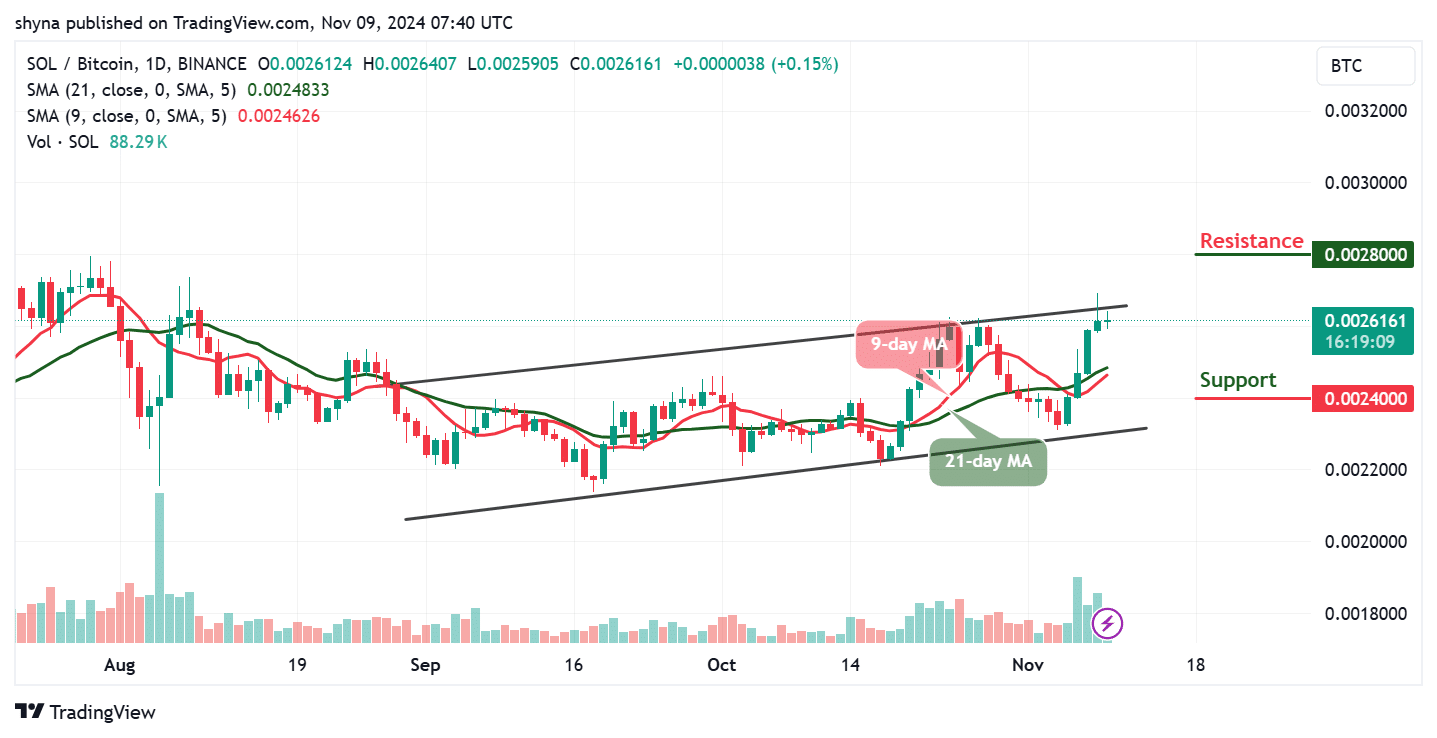
SOL/BTC Consolidates Above the Moving Averages
Solana’s price against Bitcoin is showing upward momentum as it moves above the 9-day and 21-day moving averages. This price action suggests a potential breakout above the channel’s upper boundary, which could be a bullish signal for buyers. However, if bears gain control, critical support could be found around 2400 SAT, with resistance expected above the channel and near 2800 SAT.

Further strengthening the bullish outlook, the 9-day moving average may soon cross above the 21-day moving average, indicating that momentum is favoring buyers. This crossover would reinforce the positive trend, making the setup favorable for continued upward movement.
Meanwhile, @zenithzoro highlighted to his 16,000+ followers on X (formerly Twitter) that Solana’s 4-hour chart is showing strong activity, shifting from a bearish trend to a bullish surge. SOL faces critical resistance around 184.62, where a breakout could trigger further gains. However, if there’s a pullback, the 165-170 support zone will be key; holding this level could attract buyers and support a rebound. This juncture will reveal whether SOL can continue its bullish run or if sellers will step in to defend.
$SOL 4H chart is buzzing with activity! After shifting from a bearish channel into a bullish surge, SOL now hovers at a crucial point. With a strong resistance near 184.62, a breakout could trigger a powerful upward move and ignite fresh bullish momentum. However, keep an eye on… pic.twitter.com/S0nYExhWGj
— 𝐙𝐄𝐍𝐈𝐓𝐇 𝐙𝐎𝐑𝐎 (@zenithzoro) November 7, 2024
Solana Alternatives
On the daily chart, Solana remains bullish, bolstered by strong fundamentals and positive market sentiment, particularly fueled by ETF speculation. However, technical indicators at this level advise caution, as the current resistance could trigger a pullback. In parallel, Pepe Unchained, a Layer-2 solution, provides a decentralized platform offering various financial utilities, including trading, bridging, and staking, aiming to expand the DeFi ecosystem around the popular Pepe meme. Notably, the token has raised over $27 million in its ongoing presale.
PEPE UNCHAINED NEW 100X POTENTIAL MEME COIN (LIVE SOON)
Pepe Unchained offers a unique investment opportunity as it aims to become a leading DeFi ecosystem built around the popular Pepe meme. With over $27 million already raised in its presale, the project has gained strong market interest and investor confidence. Early investors can take advantage of the project’s momentum and potential growth, making it an ideal time to join and benefit from this expanding token in the DeFi space.
Related News
- Solana Price Prediction As Canary Capital Files For Solana ETF And Experts Predict 100X Returns For This New V2E Meme Coin
- Bitcoin Shatters $80K Barrier As ‘Moonvember’ Rally Ignites, While Pepe Unchained Roars Past $26.7M Amid Intensified Whale Buying
Most Searched Crypto Launch - Pepe Unchained
- Exchange Listings December 10
- ICO Sold Out Early
- Featured in Cointelegraph
- Layer 2 Meme Coin Ecosystem
- SolidProof & Coinsult Audited
Join Our Telegram channel to stay up to date on breaking news coverage


