
Join Our Telegram channel to stay up to date on breaking news coverage
According to the daily, the Solana price prediction shows that SOL is yet to climb above the 9-day and 21-day moving averages.
Solana Price Statistics Data:
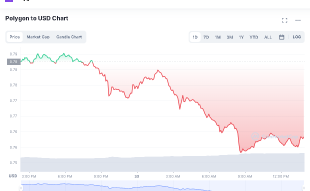
- Solana price now – $9.60
- Solana market cap – $3.5 billion
- Solana circulating supply – 367.3 million
- Solana total supply – 537.4 million
- Solana Coinmarketcap ranking – #17
SOL/USD Market
Key Levels:
Resistance levels: $30.0, $32.0, $34.0
Support levels: $2.0, $1.5, $1.0
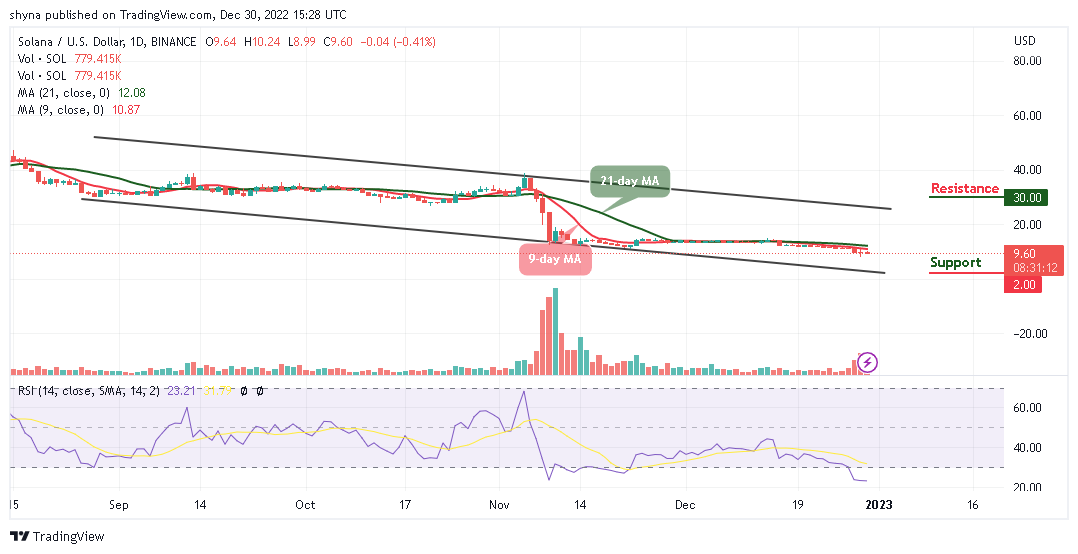
SOL/USD is currently struggling to gather momentum below the 9-day and 21-day moving averages. The nearest key level of support remains at $9.5, but if the coin breakdown with a daily candle closes below this level, it may slide toward the lower boundary of the channel.
Solana Price Prediction: Solana (SOL) May Cross Below $9.0 Support
The Solana price is currently trading below the 9-day and 21-day moving averages. However, if the market price crosses below the nearest support of $9.0, it can experience a period of bearish momentum and it could target the nearest support level at $8.0 which could hit the critical support levels of $2.0, $1.5, and $1.0. Meanwhile, for that not to happen, the coin would need to divert its movement above the moving averages.
Therefore, if Solana (SOL) breaks above this barrier, it could move to the north. Should the price decide to maintain the bullish movement; the coin could find the potential resistance levels at $30, $32, and $34 while the technical indicator Relative Strength Index (14) suggests a bearish movement as the signal line moves within the oversold region.
Against Bitcoin, the Solana price may continue to follow a bearish movement if the coin could stay below the 9-day and 21-day moving averages. However, if the bulls try to gain additional momentum, the bears may continue to release huge pressure on the market as the technical indicator Relative Strength Index (14) moves within the oversold region, to give more bearish signals.
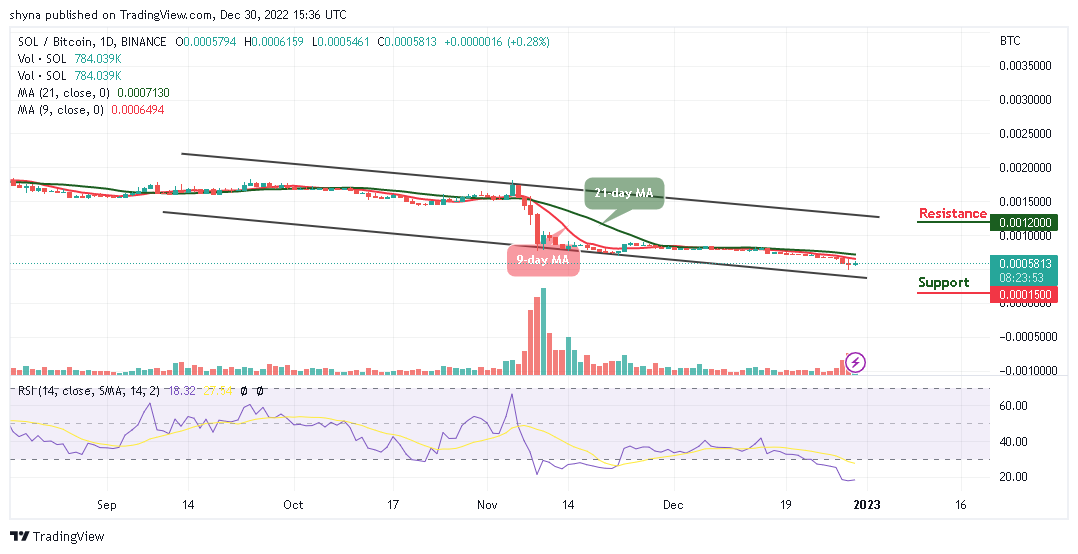
Therefore, if the Solana price slides below the lower boundary of the channel, it could hit the nearest support at 550 SAT. Any further negative movement may lower the price of the support at 150 SAT and below. In case of a rebound, the coin can revisit the 1000 SAT before resuming the rally which could see a bull run to the resistance level of 1200 SAT and above.
Best Wallet - Diversify Your Crypto Portfolio

- Easy to Use, Feature-Driven Crypto Wallet
- Get Early Access to Upcoming Token ICOs
- Multi-Chain, Multi-Wallet, Non-Custodial
- Now On App Store, Google Play
- Stake To Earn Native Token $BEST
- 250,000+ Monthly Active Users
Join Our Telegram channel to stay up to date on breaking news coverage