Join Our Telegram channel to stay up to date on breaking news coverage
The Polygon price prediction shows that MATIC is currently heading toward the south as the coin may cross below the lower boundary of the channel.
Polygon Prediction Statistics Data:
- Polygon price now – $0.753
- Polygon market cap – $6.9 billion
- Polygon circulating supply – 8.73 billion
- Polygon total supply – 10 billion
- Polygon Coinmarketcap ranking – #10
MATIC/USD Market
Key Levels:
Resistance levels: $1.20, $1.30, $1.40
Support levels: $0.45, $0.35, $0.25
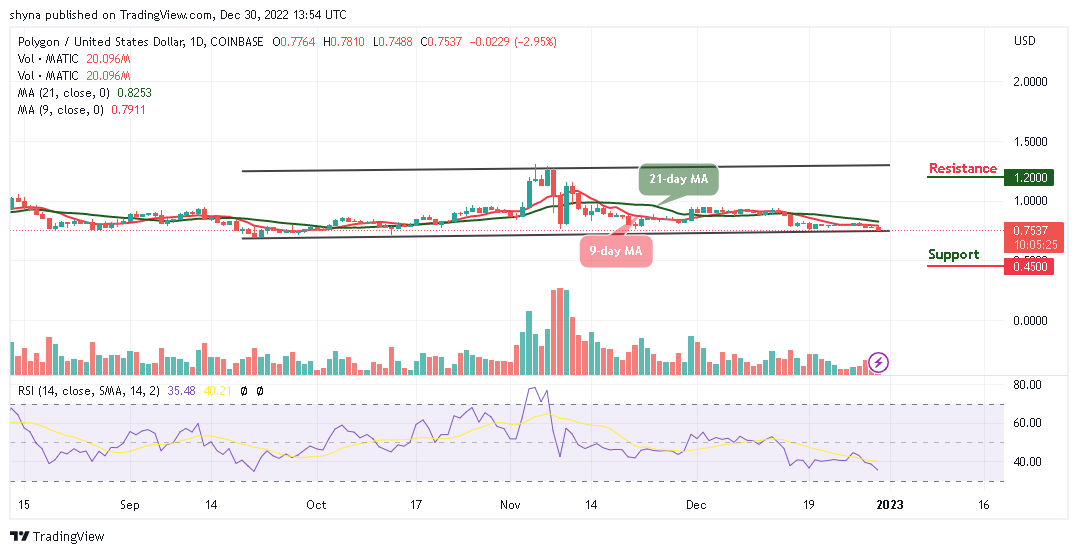
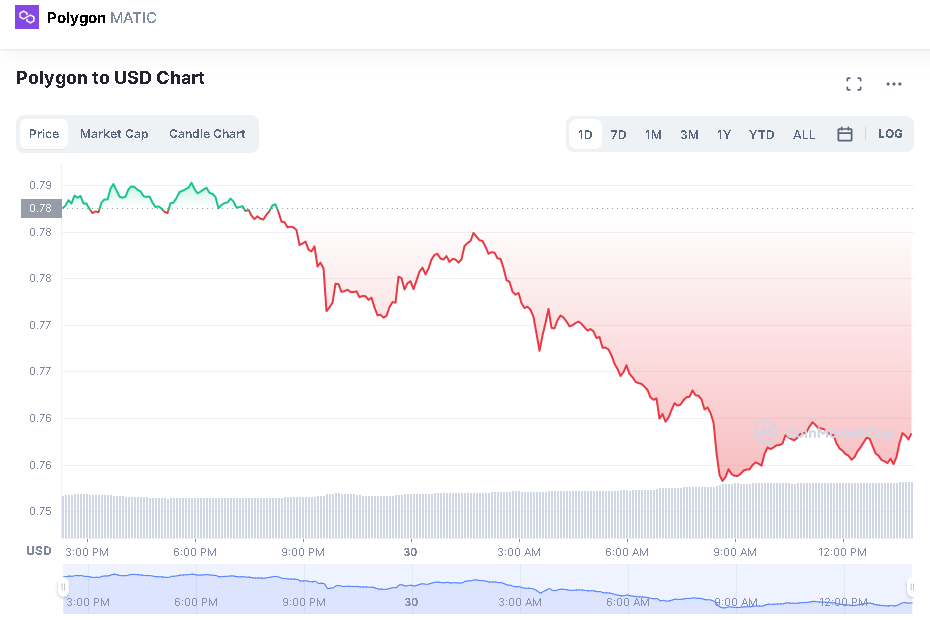
MATIC/USD opens today’s trade with an opening price of $0.77 as the coin is dropping towards $0.55 in a matter of hours. At the time of writing, the Polygon price is changing hands at $0.753, slightly down by 2.95% after a rebound from the $0.781 level. Currently, the daily chart reveals that the technical indicator Relative Strength Index (14) is heading towards the oversold region, which means the coin could be ready for more losses.
Polygon Price Prediction: Polygon May See Further Downside
Looking at the daily chart, if the sellers push the Polygon price beneath $0.50, the next support could be under the lower boundary of the channel and a further downside may come to focus at $0.50. Moreover, if this support breaks, further support levels could be located at $0.45, $0.35, and $0.25 levels while the resistance levels could be found at $1.20, $1.30, and $1.40.
Moreover, the technical indicator shows that the Relative Strength Index (14) moves below the 40-level, if the market successfully stays below this barrier, the increased bearish pressure could keep the Polygon price on the negative side. Whereas the signal line could drop more and may look primed for another bearish crossover signal.
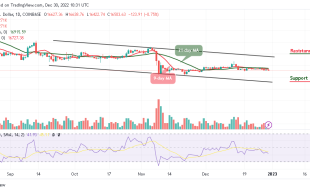
Against Bitcoin, traders can see that the Polygon price is likely to resume downward at the time of writing. As the price falls, sellers could pose more threats to buyers to reach the support level of 4000 SAT where the nearest target is located. However, any further bearish movement below the lower boundary of the channel may cause the Polygon price to collapse.
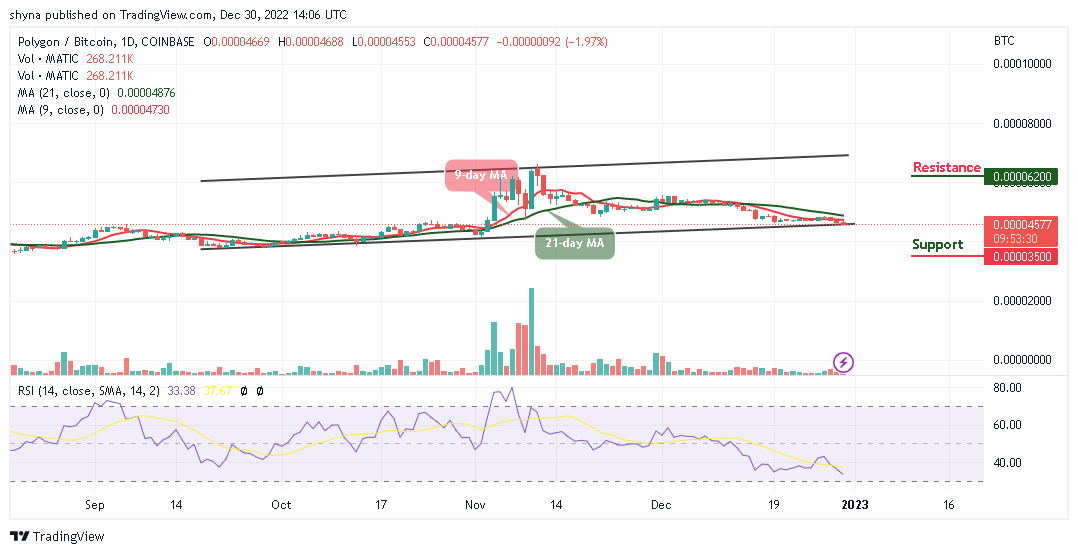
Meanwhile, the continuation of the downtrend could hit the main support at 3800 SAT before falling to 3500 SAT and below. Meanwhile, if the buyers push the market above the 9-day and 21-day moving averages, it could reach the potential resistance at 6200 SAT and above. Therefore, the technical indicator Relative Strength Index (14) moves to cross below 30-level, indicating that the sellers could dominate the market.
Best Wallet - Diversify Your Crypto Portfolio

- Easy to Use, Feature-Driven Crypto Wallet
- Get Early Access to Upcoming Token ICOs
- Multi-Chain, Multi-Wallet, Non-Custodial
- Now On App Store, Google Play
- Stake To Earn Native Token $BEST
- 250,000+ Monthly Active Users
Join Our Telegram channel to stay up to date on breaking news coverage