Join Our Telegram channel to stay up to date on breaking news coverage
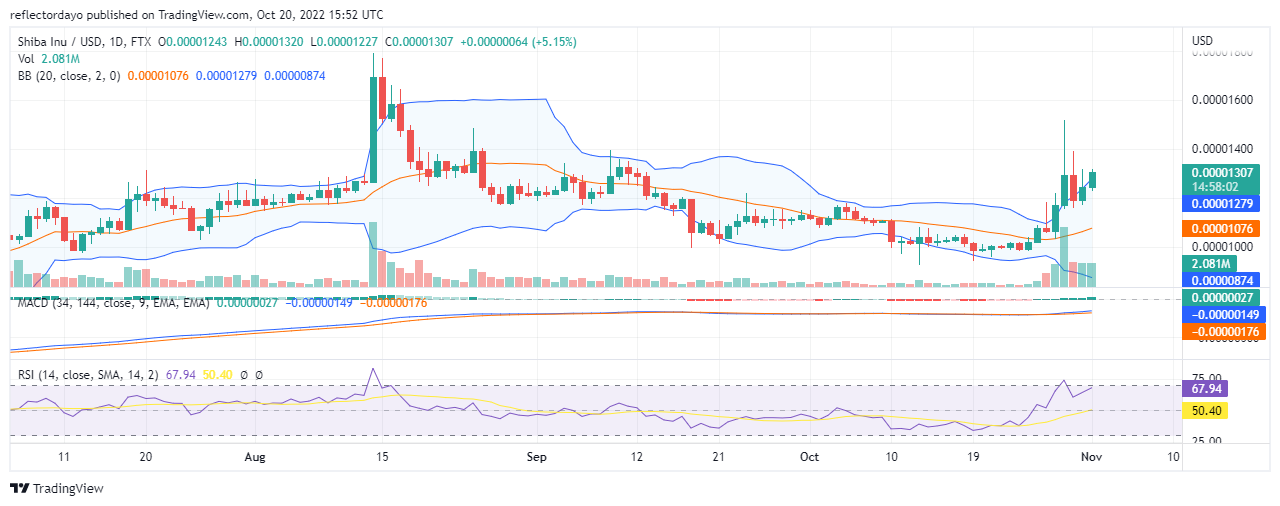
Since the middle of September, we have seen the price of Shiba inu moving in a sideway pattern, but at some point, the price had a very brief break out in favour of the bears. We can see these breakouts on the 10th of October and on the 19th of October. But because the bulls are also very strong, they prevented the downtrend while they gather momentum for a bullish market. On the 25th of October, the market finally had a breakout in favour of the bulls.
Shiba Market Price Statistic:
- SHIB/USD price now: $0.00001296
- SHIB/USD market cap: $6,992,444,689
- SHIB/USD circulating supply: 549,063.28B
- SHIB/USD total supply: 589,735,030,408,323
- SHIB/USD coin market ranking: #13
Key Levels
- Resistance: $0.000013, $0.000014, $0.0000145
- Support: $0.000011, $0.000010, $0.000009
Shiba Inu Market Price Analysis: The Indicators’ Point of View
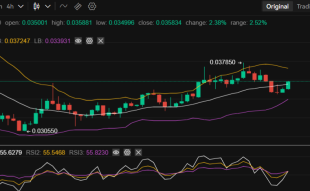
By the 26th of October, the price action has moved up above the Bollinger moving average. And as the buying pressure increases, the upper band of Bollinger responds to the price action. This means that it is likely that the market continue to go the bullish way. But after a hyper-bullish performance on the 29th of October, sellers became strong enough to reject the price and formed a strong resistance at the $0.000013 price level. The bulls, in today’s trading session, are still trying to attempt that price level. While the RSI line measures in the bullish zone of the indicator, the MACD is just still trying to recover from the bearish zone. Although the MACD histograms are bullish, the MACD lines are just changing direction to the upside. This means there is more to do for the bulls if they must establish a trend for themselves.
SHIB/USD 4-Hour Chart Outlook
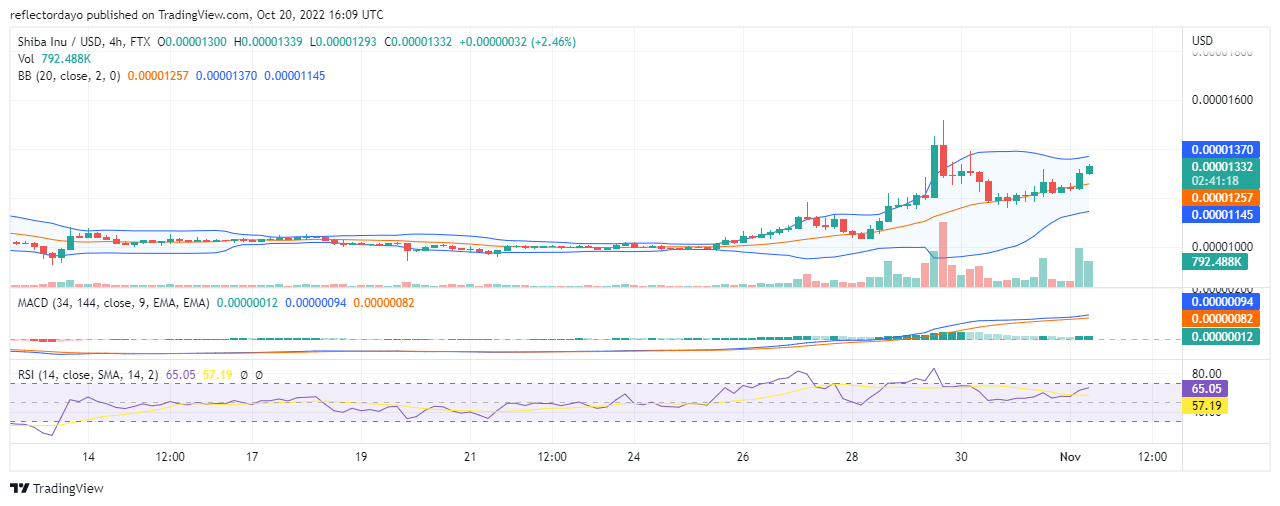
Bullish support was able to stop the bearish market move on the 30th of October at the $0.000012 price level. And then they slowly push the price near to $0.0000135. The bullish market is making progress. The MACD line has pullback from crossing the slow line due to the bullish recovery in the Shiba market.
The Dash 2 Trade presale has raised more over $3 million in the less than two weeks since it began. The sales of the token this year have been among the most explosive.
Related
Join Our Telegram channel to stay up to date on breaking news coverage
