Join Our Telegram channel to stay up to date on breaking news coverage
Very recently Shiba Inu experienced a massive jump in price action. Also, this big jump in value made the headlines. Nevertheless, ever since then, there has been some new development. In this analysis, we shall examine those new developments. We will also deduce some possible happenings that may occur in this market.
SHIB/USD Current Price: $0.00001581
SHIB’s Market Capitalization: $8.8 billion
SHIB’s Systemic Supply: 548.1 billion
SHIB’s Overall Supply: 548.7 billion
SHIB’s Coinmarketcap Position: #12
Important Levels:
Resistance: $0.00001450, $0.00001550, $0.00001650
Support: $0.00001581, $0.000014500, $0.00001390
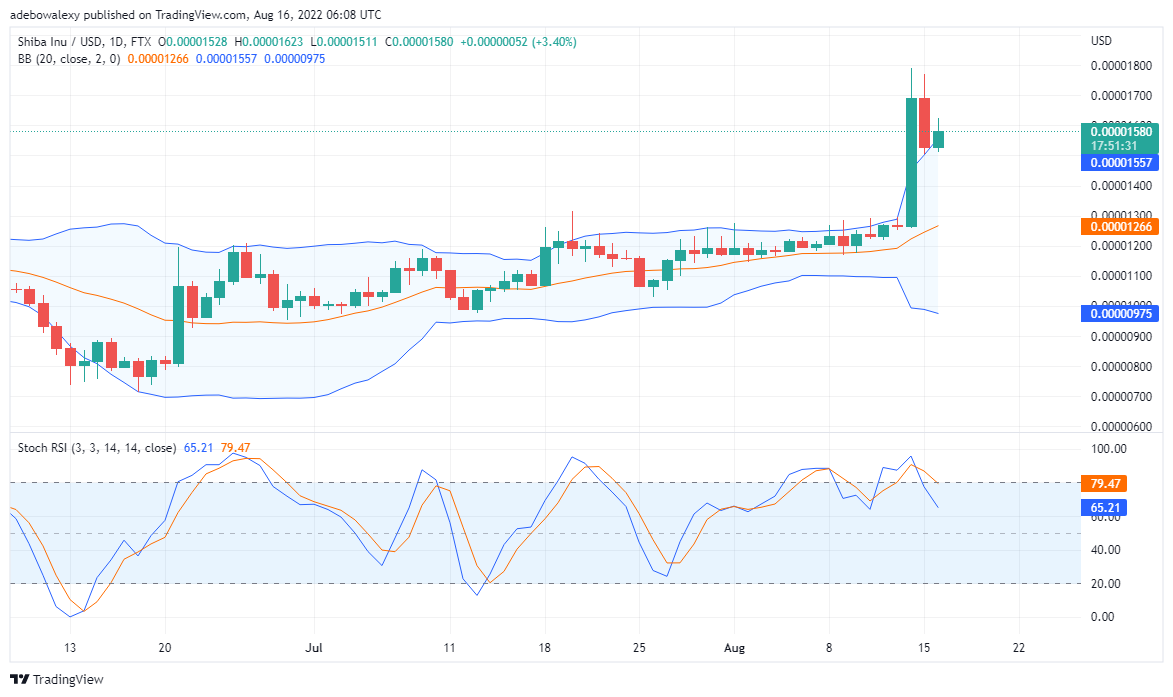
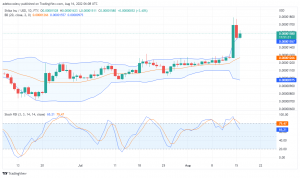
SHIB Price Rejected at Upper Bollinger Band
The SHIB/USD daily chart reveals that Shiba Inu has rebounded against resistance. The rule behind the Bollinger indicator on this chart follows that, once either the lower or upper band has been tested, the price will bounce in the opposite directions. Consequently, we can perceive from this chart that this is exactly what has happened in this market. We can see that the bulls have a big thrust on price movement, eventually, this tested and stretched the upper band of the indicator. Subsequently, we can now see that Shiba Inu’s price I currently on a downtrend, towards the middle MA line of the indicator.
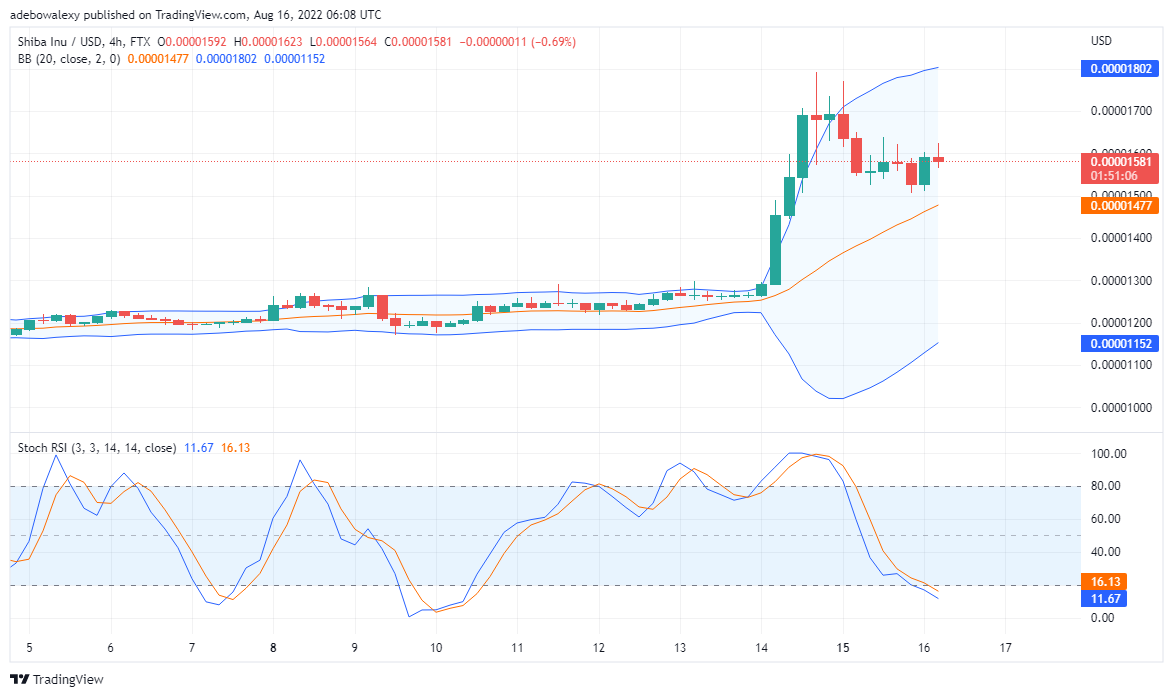
Shiba Inu Price Analysis: The True Nature of SHIB/USD Downtrend Revealed
On the SHIB/USD 4-hour chart, the nature of the current trend appears to be clearer. Here we can see that the bearish candles have pushed price activity towards the Mid-line of the Bollinger band. However, the bulls resisted the activities of the bears with a big bullish candle, but the bears managed to stay on.
Your capital is at risk.
Although the last candle on this chart formed as a bearish one, its size hinted how much fight is left in the bears. Additionally, the Stochastic RSI lines are now in the oversold area, also they are very close to each other. This indicates that an upward correction is very near. Furthermore, is possible that the upper band of the Bollinger indicator is tested once more. Although the Mid-line of the Bollinger indicator may be tested an uptrend may likely resume somewhere there. As buying pressure may resume soon Traders in this market can anticipate the price of Shiba Inu to value at around $0.00001700.
Related
Join Our Telegram channel to stay up to date on breaking news coverage