Join Our Telegram channel to stay up to date on breaking news coverage
Shiba Inu (SHIB) price has steadily declined since April 19 after a rejection from the 200-day Simple Moving Average (SMA). The downtrend came as the meme coin community awaited Twitter CEO Elon Musk’s 420 memes event.
In case you missed it, four-twenty is deeply embedded in the meme culture. It sprouts from the norm of smoking cannabis at 4:20 PM. However, the concept has recently metamorphosed to April 20, christened 420 in Twitter jargon. It is commemorated yearly with Cannabis-oriented celebrations.
Twitter’s Musk is a keen proponent of memes, having embraced Dogecoin (DOGE) many years ago. In a podcast with Joe Rogan, the billionaire smoked Cannabis, provoking a massive reaction in Tesla and SpaceX stock prices. Moreover, Musk got into big trouble with the regulators after tweeting, “…$420. Funding secured.”
Am considering taking Tesla private at $420. Funding secured.
— Elon Musk (@elonmusk) August 7, 2018
On April 20, SpaceX recorded an epic collapse after exploding shortly after launch. The powerful rocket lifted off the launch pad but exploded 240 seconds later when it failed to separate from its booster. This disappointment opened the drains for Shiba Inu and Dogecoin prices, causing a 6% loss in the latter, as reported. Since then, SHB has slumped almost 50% to a zone now being tested.
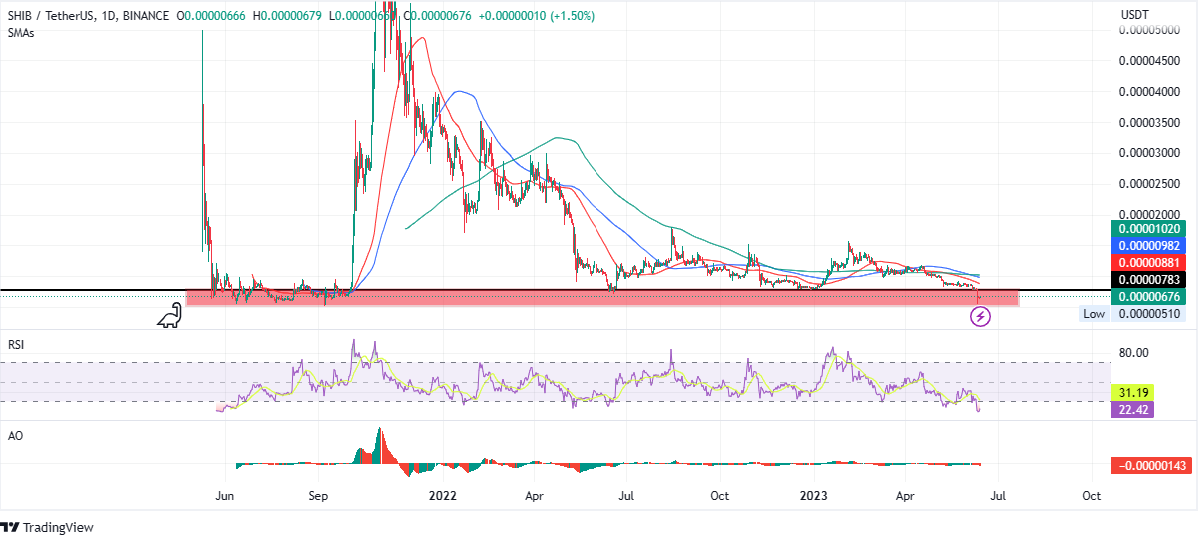
Nevertheless, the highlight of the free fall for Shiba Inu price came on June 9. This was after the meme coin lost critical support at $0.00000783. While SHIB dipped to record an intra-day low of $0.00000543, it has since bounced back a staggering 25%. At the time of writing, the dog-themed crypto is exchanging hands for $0.00000677.
Shiba Inu Price Recovers 25% Thanks to $100 Million In Trading Volume
Shiba Inu price has recorded a stark recovery, all factors (broader market gloom, regulatory distress, and the prolonged bear market) considered. The token attempts to recover from a zone last tested during the second quarter of 2021, as shown in the daily chart below.

Notably, while the buyer momentum remains low, an influx of trading volume aggregating to $100 million inspires hope. The sudden surge in trading volume has boosted the SHIB market recovery. Trading volume typically serves as a technical indicator as it represents the overall activity of an asset or a market. Investors can use trading volume to confirm the existence or continuation of a trend or a trend reversal.
Notwithstanding, some industry sleuths remain skeptical about the positive effect of the spike in trading volume on Shiba Inu price. Based on the current outlook, skepticism is warranted, considering Shiba Inu price remains bearish.
The chaotic price action displayed by Shiba Inu price shows that most holders opt to either clam up or simply give up and dump their SHIB tokens. Nevertheless, the next course of action for the popular meme coin will depend on how bulls play their hand.
Shiba Inu Price Forecast As SHIB Bulls Push To Escape a Crucial Zone
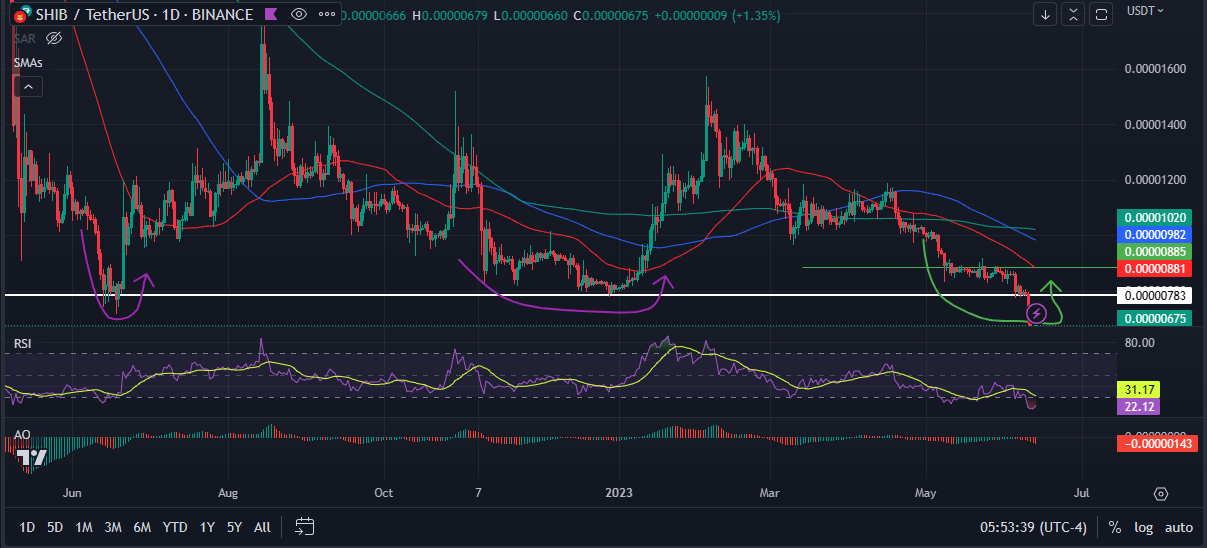
An increase in buyer momentum could see Shiba Inu price rise to restore above the critical support at $0.00000783. Such a move could trigger a continuation north for SHIB, considering SHIB bounced northwards every time it tested it.
The next northbound move could see Shiba Inu price break above the resistance confluence between the horizontal line and the 50-day SMA at $0.00000881. Further north, SHIB could tag the 200-day SMA at $0.00000982 before a foray above $0.00001000 to confront the 100-day SMA at $0.00001020.
In a highly bullish case, Shiba Inu price could ascend to breach the psychological $0.00001200, denoting an 80% upswing. Nevertheless, the overall bearish outlook would only be invalidated once SHIB makes a decisive daily candlestick close above the psychological $0.00001600. Above this supplier congestion zone, the popular meme coin could have a chance at retesting the $0.00001800 range high.
The bullish outlook draws support from the Relative Strength Index (RSI), which had tipped north to show rising momentum. Furthermore, its position deep below 30 indicated SHIB was oversold, thereby hinting at a looming pullback or correction.

Converse Case with On-chain Metric To Support
If seller momentum overpowers the bulls, Shiba Inu price could drop further to record a new all-time low. This would be below the lowest level of $0.00000510, last tested around September 2021. Notably, this is possible considering the Awesome Oscillators (AO) were in the negative zone with histograms flashing red. This indicates that bears are still leading the market.
It is also worth mentioning that SHIB traders could not execute the bullish crossover authenticated around June 3. This was when the 100-day SMA crossed above the 200-day SMA. In tandem with this technical formation, Shiba Inu price attempted an uptick, but bearish dominance prevented a recovery.
The Shiba Inu price will remain bearish until the SHIB bulls muster enough momentum to sustain an uptrend.
Global In/Out of the Money
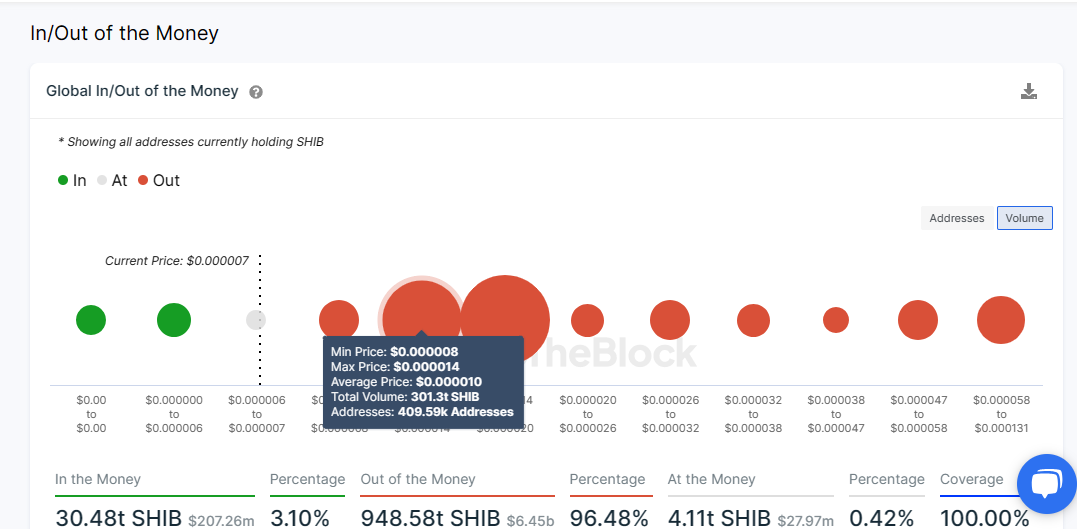
On-chain metric from IntoTheBlock’s Global In/Out of the Money (GIOM) indicates that SHIB faced robust resistance northward. This is present within the $0.00000800 and $0.00001400 range.

Any attempts to raise Shiba Inu price above this zone would be countered by massive selling pressure from the 409,590 addresses that bought approximately 301.3 trillion Shiba Inu tokens at an average price of $0.00001000.
SHIB Alternative
Fortunately for them, there isn’t a shortage of tokens presenting themselves as an alternative. For the most part, investors are flocking to new projects like YPRED. It is a token committed to empowering the world’s first “all-in-one” AI ecosystem, specifically built for developers, traders, quants, and analysts.
🚀 Embark on an extraordinary AI-powered journey with #YPredict! It’s not just a utility token, but a gateway to a world of groundbreaking products and possibilities. 🌐🔬
💡 Experience unparalleled marketing excellence with our industry-leading content editor, designed to… pic.twitter.com/heQoBiRmPS
— yPredict.ai (@yPredict_ai) June 12, 2023
YPRED is the native asset for the yPredict.ai ecosystem, presenting a project uniquely capable of automatically identifying hundreds of bullish and bearish charts and candlestick patterns. It generates real-time alerts when these patterns are formed and a reliability score based on the overall past accuracy of the expected price behavior after the pattern is formed.
📣 Exciting news! Introducing #YPredict, the revolutionary AI marketplace! 🌐🤖
🔬🚀 With a vision for a complete AI ecosystem, the YPredict team is powering multiple AI projects under one roof. From machine learning to natural language processing, computer vision to deep… pic.twitter.com/vm6n5ln05Q
— yPredict.ai (@yPredict_ai) June 10, 2023
YPRED is currently in the sixth presale stage, auctioning for $0.09 per token. With only six days left to the next stage, investors have a narrow window to buy YPRED at current rates before the value goes up to $0.12. Notably, the project has collected over $2.335 million so far, evidencing the strong fundamentals that continue to draw investors.
Related News
- How to Buy Shiba Inu Coin – Invest with Low Fees Today
- Dogecoin Fans Are Calling Out For This Urgent Change
- Twitter Bot’s Native Token $JIM Skyrockets 80%: Is yPredict the Next AI Coin Set to Explode?
- yPredict’s Presale Skyrockets to Over $2 Million as Revolutionary AI-Powered Crypto Price Prediction Platform Introduces Cutting-Edge Content Editing System
Best Wallet - Diversify Your Crypto Portfolio
- Easy to Use, Feature-Driven Crypto Wallet
- Get Early Access to Upcoming Token ICOs
- Multi-Chain, Multi-Wallet, Non-Custodial
- Now On App Store, Google Play
- Stake To Earn Native Token $BEST
- 250,000+ Monthly Active Users
Join Our Telegram channel to stay up to date on breaking news coverage


