Join Our Telegram channel to stay up to date on breaking news coverage
XRP Price Analysis – July 21
XRP is still in the bearish zone. So now the question is when is the sleeping shark going to wake up? The investors are already looking forward to some escalations. Let’s hope that we see the value sliding to ‘sell’ phase soon enough.
XRP/USD Market
Key Levels:
Supply levels: $0.40, $0.42, $0.44
Demand levels: $0.22, $0.20, $0.21

In the past 5 days, the value was seen at the lowest on 16th July at $0.287 trading value. The value escalated by 12.71% on 18th July. Next day, on 19th July, the value of Ripple dropped by -3.88% with $0.3118 trading valuation. Yesterday on 20th July, it was seen at the highest after an increase of 9.07%. However, the value now is decreased slightly by -3.34% from yesterday.
Looking at the chart, the value of XRP is currently trading at $0.327, moving in an upward trend within the descending channel and below the 50-day moving average. The nearest resistance levels are $0.40, $0.42 and $0.44 respectively while the nearest support levels are $0.25, $0.23 and $0.21. The rise from the resistance zone at $0.31 led to volatility and instability, but it’s technically important to hold above that range as both the RSI (14) and stochastic RSI are supporting the bulls.
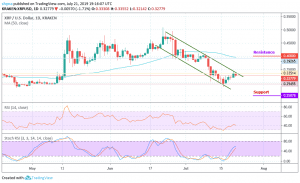
XRP/BTC Market
Against Bitcoin, the decline has continued and all support at the 3200SAT level has broken down. The price is set to test 2100SAT if Bitcoin’s gains continue to impact the XRP price. The last time the price dropped from 300SAT was December 2017, and we are now moving away from the resistance at 4000SAT.
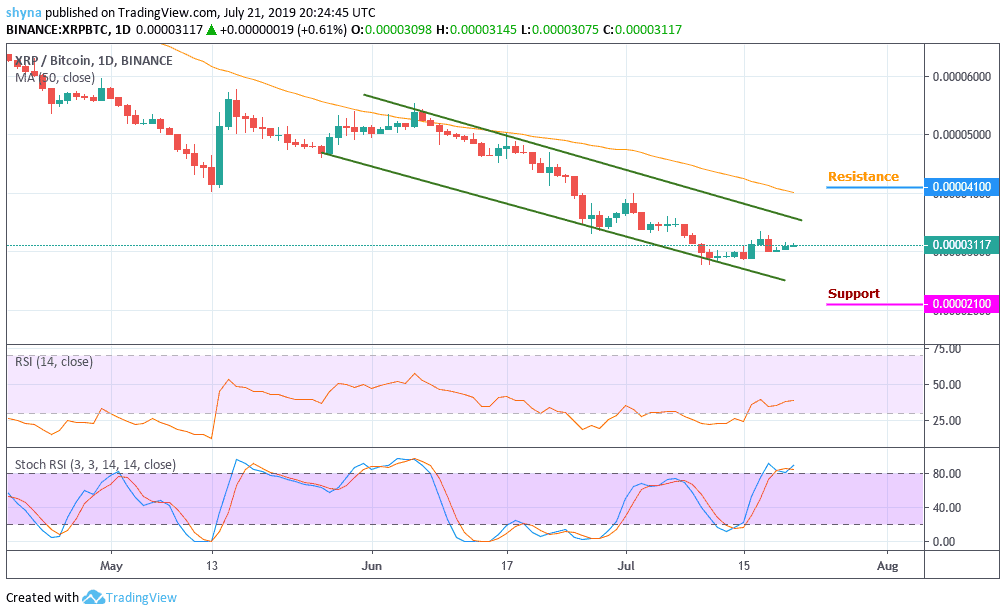
However, the bearish scenario still remained dominant within the channel as the bears are putting pressure on the bulls. If the bears occupy their positions, the XRP may drop to support level of 2100SAT and below. At present, the RSI (14) is currently trading at 39-level, while the stochastic RSI is at the overbought territory.
Please note: insidebitcoins.com is not a financial advisor. Do your own research before investing your funds in any financial asset or presented product or event. We are not responsible for your investing results.
Join Our Telegram channel to stay up to date on breaking news coverage