Join Our Telegram channel to stay up to date on breaking news coverage
BCOUSD Price Analysis – July 21
The breakout of the price at $70 level will make the BCOUSD price to reach the $79 price level while a further increase of the Bears’ momentum will reduce the price to $58 level.
BCO/USD Market
Key levels:
Supply levels: $70, $79, $85
Demand levels: $64, $58, $49
BCOUSD Long-term Trend: Ranging
Brent Crude Oil is ranging on the long-term outlook. BCOUSD price has not made any significant movement for more than five weeks; the price has been ranging around $64 price level. Increase in price of the Brent crude Oil was resisted at the dynamic resistance level of 21 and 50 periods EMAs last week.
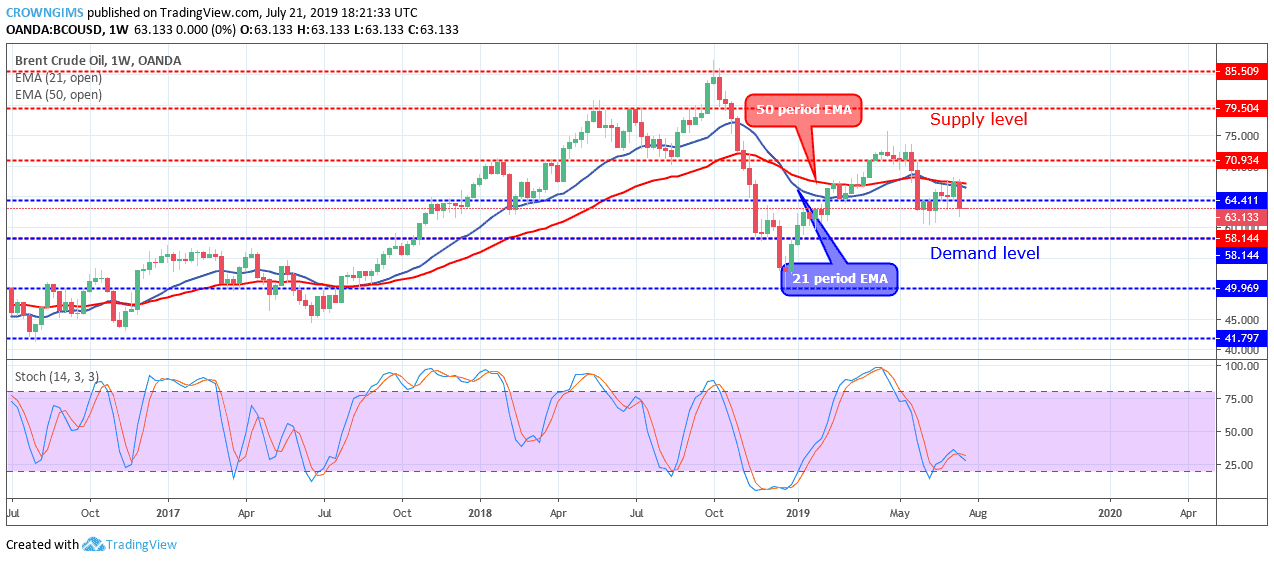
Last week Brent Crude Oil price was bearish and the price closed below the $64 level. The price was trading over and around the 21 periods, EMA and 50 periods EMA and the two EMAs are interlocked to each other as a sign of consolidation. However, the Stochastic Oscillator period 14 is above 25 levels with the signal lines bending down to connotes sell signal. The breakout of the price at $70 level will make the BCOUSD price to reach the $79 price level while a further increase of the Bears’ momentum will reduce the price to $58 level.
BCOUSD medium-term Trend: Bearish
Brent Crude Oil is bearish on the daily chart. The bulls lost their momentum after broken up the confluence at $64 price level on July 12. The Bears exerted pressure in the market and the price declined, penetrated the two EMAs and the $64 price level downside. BCOUSD price daily market closed last week with the price heading towards $58 level.
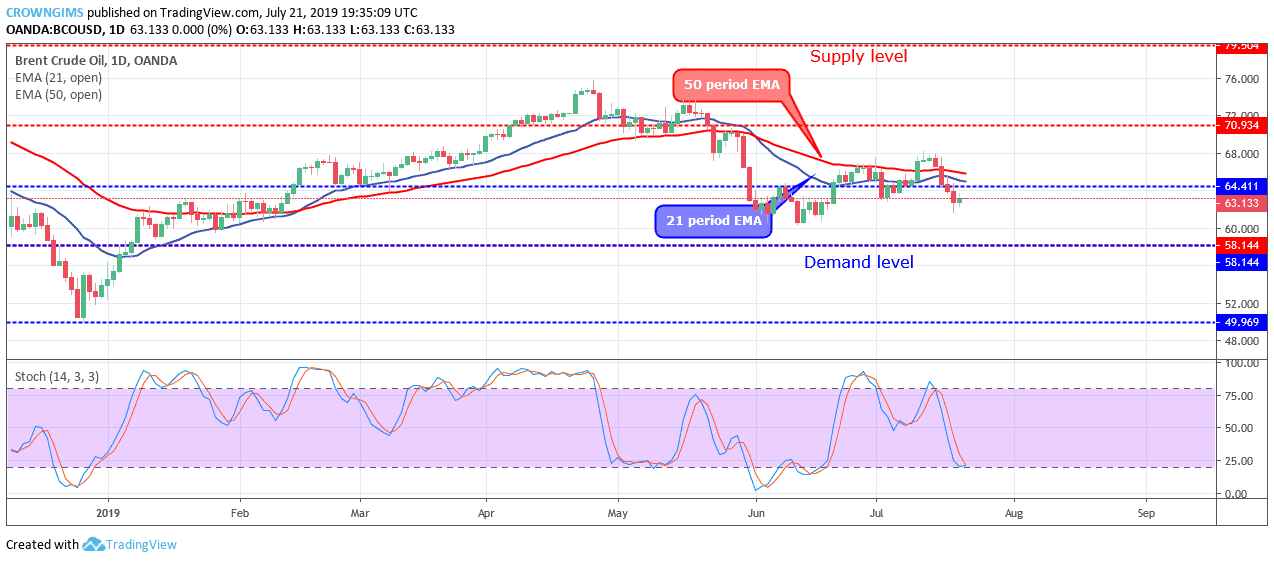
The price is trading below the 50 periods EMA and the 21 periods EMA. The Stochastic Oscillator period 14 is at 25 levels with the signal lines pointing down to indicates sell signal.
Please note: insidebitcoins.com is not a financial advisor. Do your own research before investing your funds in any financial asset or presented product or event. We are not responsible for your investing results.
Read more:
Join Our Telegram channel to stay up to date on breaking news coverage