Join Our Telegram channel to stay up to date on breaking news coverage
XRP Price Prediction – October 28
The XRP bulls are resisting $0.32, but the price could rebound at $0.27.
XRP/USD Market
Key Levels:
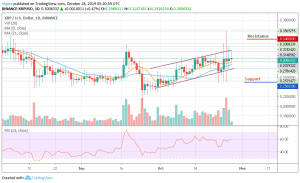
Resistance levels: $0.34, $0.36, $0.38
Support levels: $0.25, $0.23, $0.21

The XRP/USD continued to post substantial growth after the October 24 bullish reversal. In recent days, price changes have caused the XRP to fall back to $0.273, although the market remains bullish in the near term. Looking at the current price gain of 0.47%, the third-largest cryptocurrency could continue its upward trend if the $0.27 could continue to provide support.
In addition, the price of Ripple has consistently maintained a high rise and a minimal decline in recent days, causing the market to hit $0.356 on October 26. The price of XRP is now trading around $0.300 after a slight downturn in the market. Despite this decline, the XRP/USD market is also above 9 and 21-day moving averages, placing the market under the bull radar.
Furthermore, should in case the price breaks out of the ascending channel, resistance levels of $0.34, $0.36 and $0.38 could be achieved. Meanwhile, the market can be sustained at support levels of $0.25 and $0.23; peradventure the price falls below previous levels, another support is around $0.21. RSI (14) is trying to break the 60-level in order to forge ahead.
As far as Bitcoin is concerned, XRP is currently changing hands at 3113 SAT and it’s trading under the 9-day and 21-day MA. If the above-mentioned level can serve as market support, the price can be pushed up and the key resistance lies 3,500 SAT and 3,600 SAT. By reaching these levels, the price may likely move the price to 3800 SAT and 4000 SAT resistance levels.
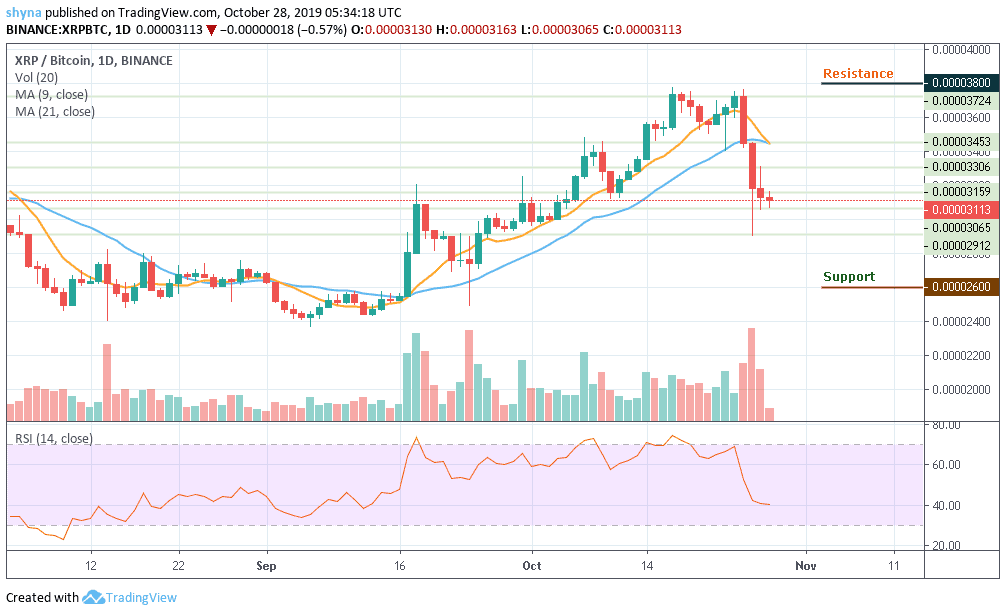
However, if the bulls fail to push the price to the nearest resistance, the market may continue its downtrend and the pair could probably record further declines at 3,000 SAT. Breaking this level could further push the market to the nearest support levels, at 2600 SAT and below as the trend line of RSI (14) reaches level 40, which could possibly give some bearish signals for the next few days.
Please note: Insidebitcoins.com is not a financial advisor. Do your research before investing your funds in any financial asset or presented product or event. We are not responsible for your investing results.
Join Our Telegram channel to stay up to date on breaking news coverage