Join Our Telegram channel to stay up to date on breaking news coverage
XRP Price Prediction – November 22
Since November 7, Ripple (XRP) has been trading in a downtrend while the bulls are making a serious effort to protect the support.
XRP/USD Market
Key Levels:
Resistance levels: $0.26, $0.28, $0.30
Support levels: $0.20, $0.18, $0.16
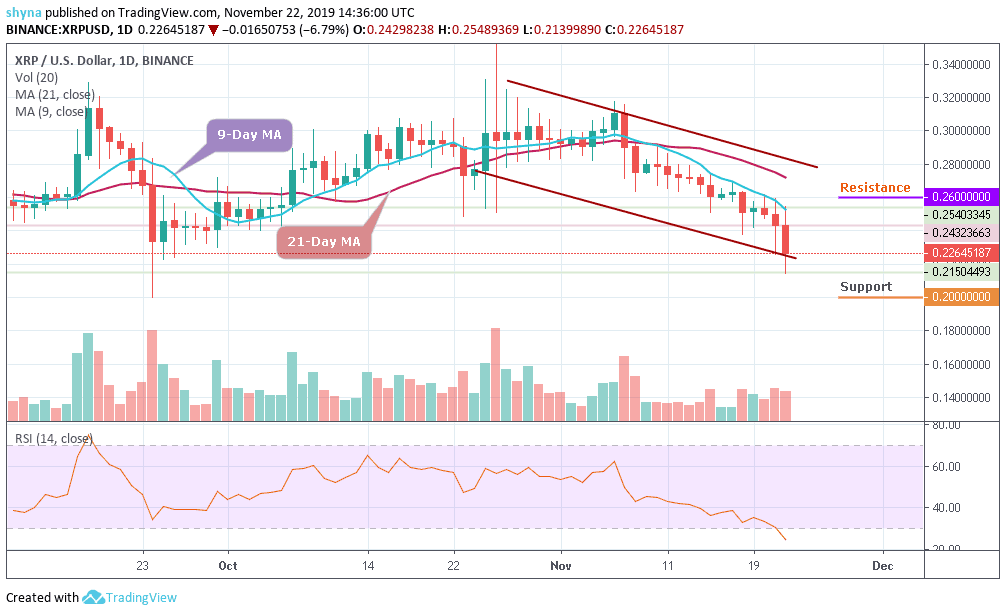
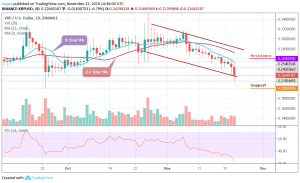
The Ripple (XRP) price is following a downtrend below the $0.23 support level against the US dollar. The price is currently trading around the $0.22 support and it could continue to decline. Meanwhile, this week’s crucial bearish trend line is intact with resistance near $0.26 on the daily chart. XRP/USD price remains at a risk of more losses below the $0.22 and $0.21 supports.
Moreover, the price of Ripple (XRP) has continued to demonstrate a sign of weakness across its markets. Similarly, the market has seen a sharp decline breaking the $0.24 support level and settled well below the 9-day and 21-day moving averages within the descending channel. Furthermore, the recent decline later pushed the price below the $0.23 level and a new monthly low was formed near the $0.22 support level as the price is currently consolidating losses.
Nevertheless, if the $0.22 support can suppress the on-going selling pressure, we may expect the price to bounce back. For now, the nearest resistance for the market is $0.26, $0.28, and $0.30. As it appeared on the daily chart, there’s no sign of a decisive move at the moment. However, if the $0.22 support gets weak, a price break-down may occur as the bears may find a new monthly low at $0.20, $0.18 and $0.16 support levels. The RSI (14) is now well within the oversold territory.
Compared with Bitcoin, the pair is consolidating within the channel and moving above the 9-day and 21-day moving averages. Meanwhile, the buyers have been trying to push the price above the channel while the bullish continuation may take it to the resistance levels of 3370 SAT and above.
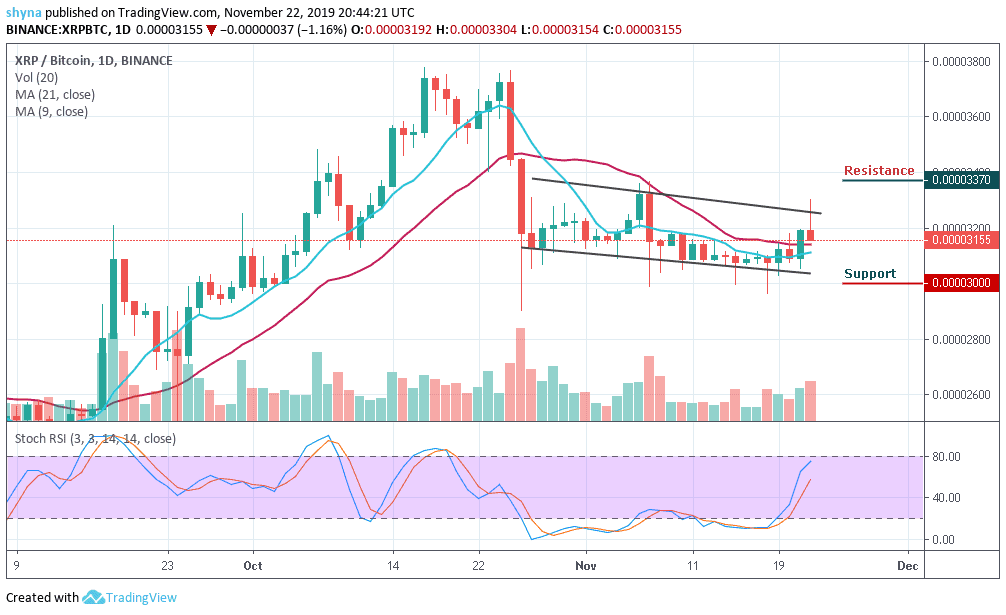
Moreover, looking at the daily chart, if the bulls failed to hold the price, then it may likely fall below the moving averages and the nearest support levels for the coin are 3000 SAT and 2900 SAT. The stochastic RSI moves above level 50, which indicates some bullish signals.
Please note: Insidebitcoins.com is not a financial advisor. Do your research before investing your funds in any financial asset or presented product or event. We are not responsible for your investing results.
Join Our Telegram channel to stay up to date on breaking news coverage