Join Our Telegram channel to stay up to date on breaking news coverage
XRP Price Prediction – December 27
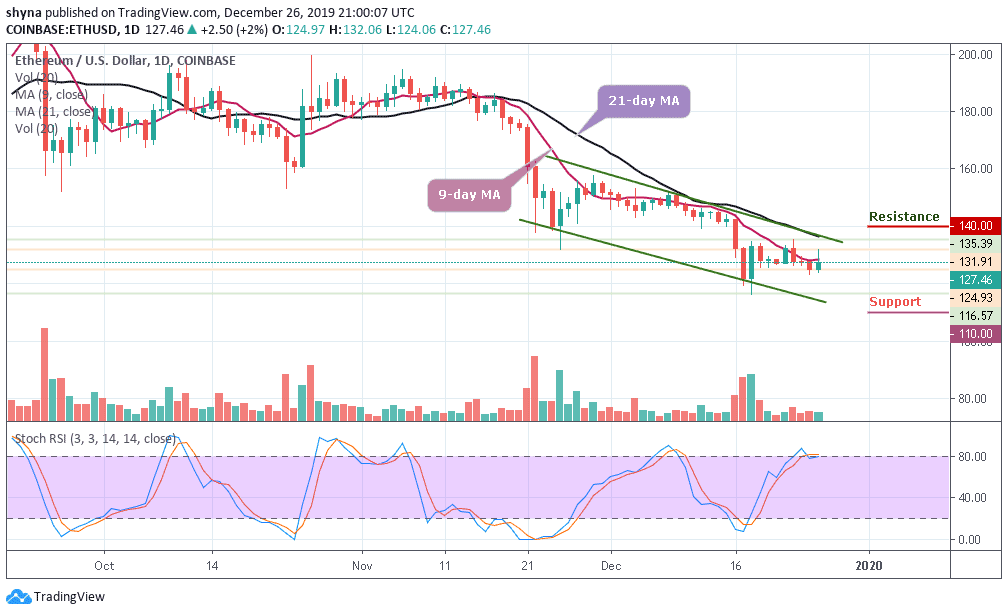
For the past 10 days, XRP/USD continues to trade sideways between $0.182 and $0.197.
XRP/USD Market
Key Levels:
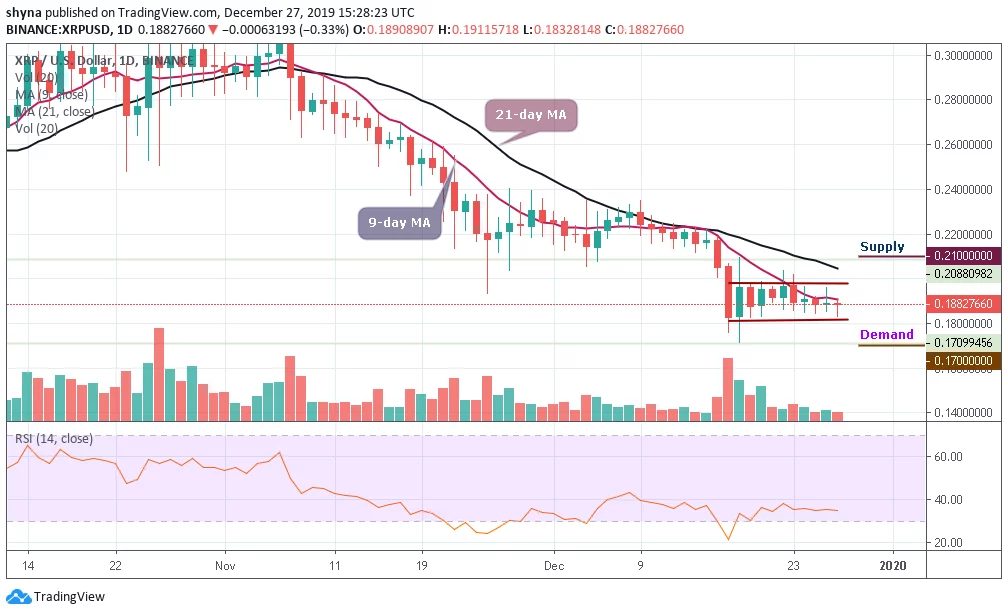
Supply levels: $0.210, $0.220, $0.230
Demand levels: $0.170, $0.160, $0.150
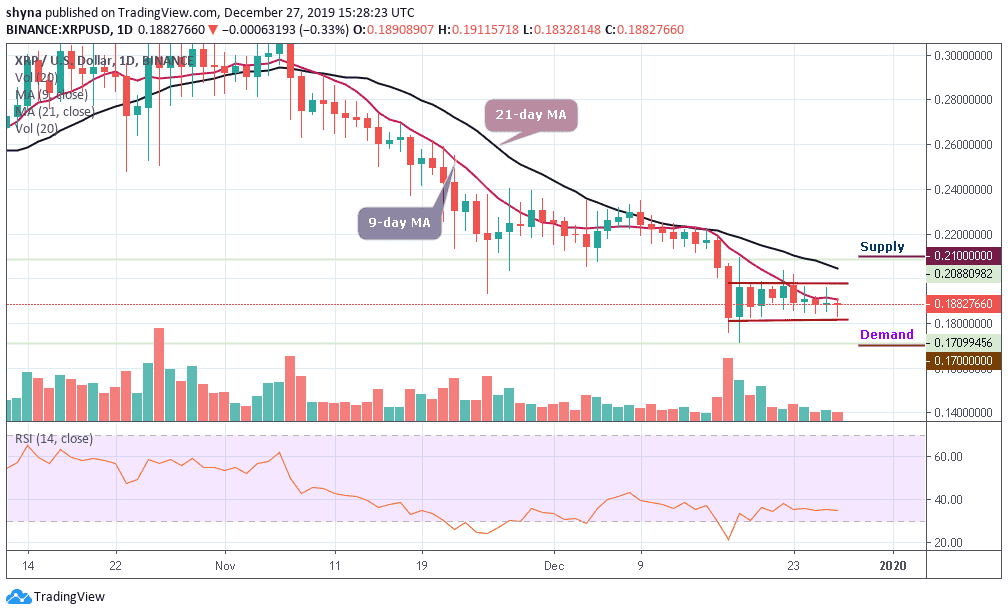
The daily chart shows the clear sideways movement that XRP/USD has experienced over the past two weeks of trading. It is unable to break above the supply at $0.20 but continues to be supported at the $0.1815 demand. A break above this range may likely dictate the next direction which the market would head toward.
A break beneath the demand at $0.181 would send XRP into a bearish spiral as 2020 starts to trade. Alternatively, a break above $0.200 might see the coin heading back toward $0.250 as January begins. If the sellers push the market back beneath $0.185, the demand at the $0.181 level should continue to hold. Beneath $0.180, additional demand is located at $0.170, $0.160, and $0.150.
On the other hand, if the people that buy Ripple regroup and push higher, the initial strong supply is found at $0.200. Above this, a higher supply lies at $0.210, $0.220, and $0.230. The RSI (14) indicator moves in the same direction, which indicates a sideways movement at the moment.
Against Bitcoin, the pair is consolidating within the channel and moving below the 9-day moving average. Meanwhile, the buyers are making effort to push the price above the moving average of which the bullish continuation may likely take it to the supply levels of 2800 SAT and 2900 SAT respectively.
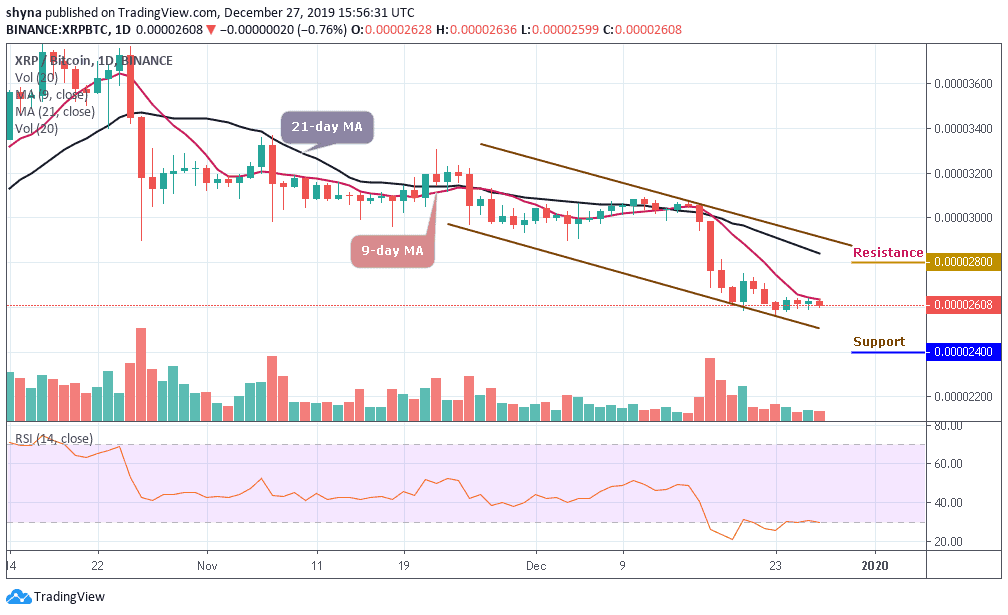
However, if the bulls failed to hold the price, then it could fall towards the lower boundary of the channel and the nearest demand levels to be met are 2400 SAT and 2300 SAT. Moreover, the RSI (14) moves in the same direction around 30-level, which indicates some sideways movement.
Please note: Insidebitcoins.com is not a financial advisor. Do your research before investing your funds in any financial asset or presented product or event. We are not responsible for your investing results.
Join Our Telegram channel to stay up to date on breaking news coverage