Join Our Telegram channel to stay up to date on breaking news coverage
XRP Price Prediction – May 9
The Ripple (XRP) is making an attempt to keep its upward movement as the buyers are struggling to move the cryptocurrency to a new height.
XRP/USD Market
Key Levels:
Resistance levels: $0.26, $0.27, $0.28
Support levels: $0.18, $0.17, $0.16
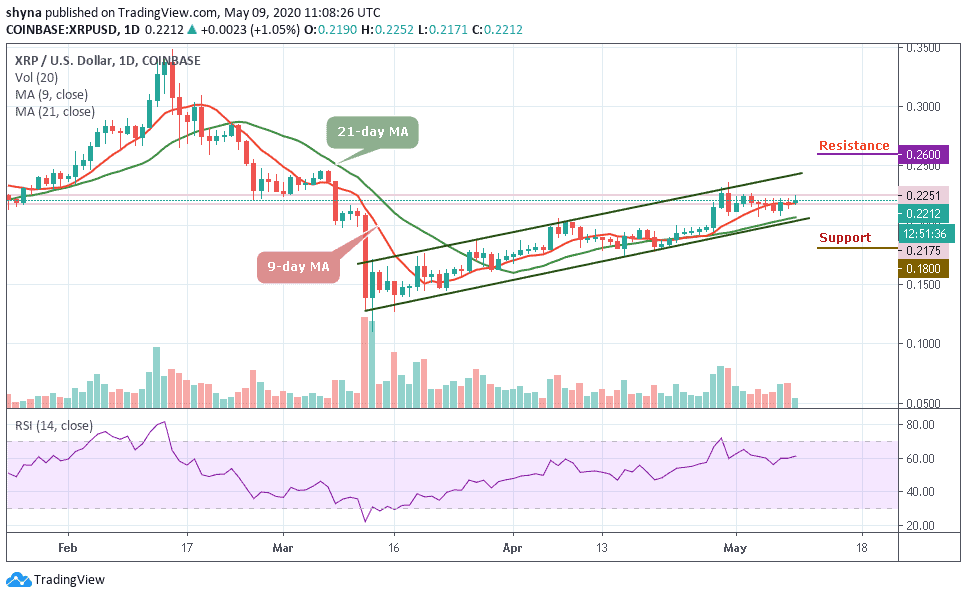
XRP/USD has been increasing slowly since May 1, earning around 1.05% as the buyers keep its upward movement today. Looking at the daily chart, Ripple (XRP) has been rising slowly for a few days after a bearish rally. The market after touching the high of $0.225 in the early hour of today is currently experiencing the sideways movement as it trades around 9-day moving average, which is heading towards the resistance level of $23.
However, XRP remains the third-largest cryptocurrency with a market cap of $9.6 billion. The Ripple price has seen a slight increase in the market over the past 24 hours and it is currently trading around $0.221. For now, XRP/USD has been back on the rise after touching the low of $0.20 support level a couple of days ago. Moreover, should in case the price breaks above 9-day MA to cross above the channel, then, the resistance levels of $0.26, $0.27 and $0.28 could be visited.
Meanwhile, for a backward movement, any movement below the lower boundary of the channel, the market may likely experience a severe downtrend and it can be supported at levels of $0.18 and $0.17 and if the price falls below the previous levels, another support is around $0.22. Therefore, the Ripple (XRP) may follow the sideways movement as RSI (14) moves in the same direction at 60-level.
As far as Bitcoin is concerned, XRP is currently changing hands at 2283 SAT and it’s trading under the 9-day and 21-day MA. If the above-mentioned level can serve as market support, the price can follow the uptrend and the key resistance lies at 2500 SAT and 2700 SAT. The RSI (14) has just recovered from the oversold zone, now moving towards the 40-level.
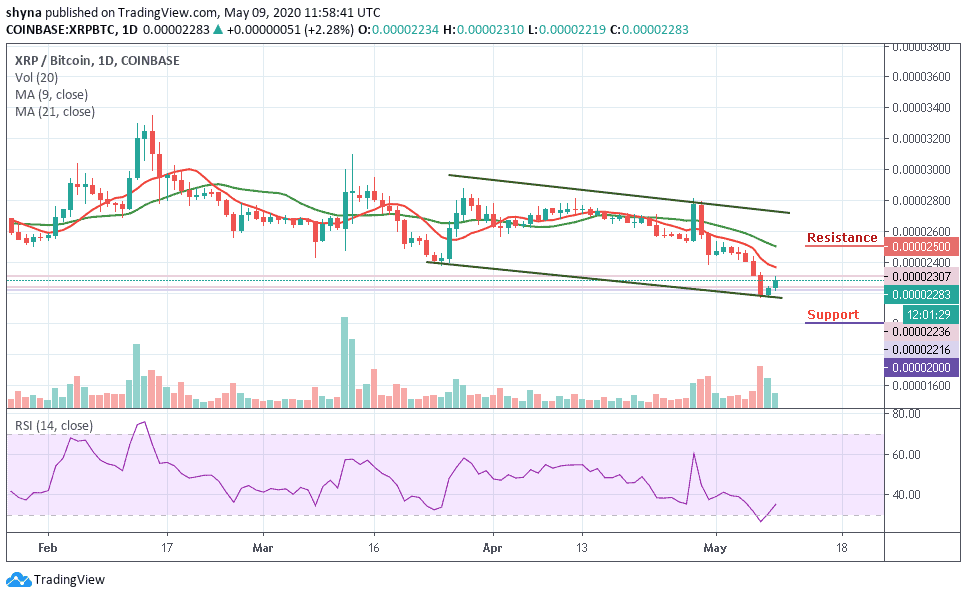
However, if the bulls fail to push the price to the nearest resistance, the market may continue its downtrend and the pair could probably record further declines at 2100 SAT. Breaking this level could further push the market to the nearest support level, at 2000 SAT and below.
Please note: Insidebitcoins.com is not a financial advisor. Do your research before investing your funds in any financial asset or presented product or event. We are not responsible for your investing results.
Join Our Telegram channel to stay up to date on breaking news coverage