Join Our Telegram channel to stay up to date on breaking news coverage
XRP Price Prediction – January 12
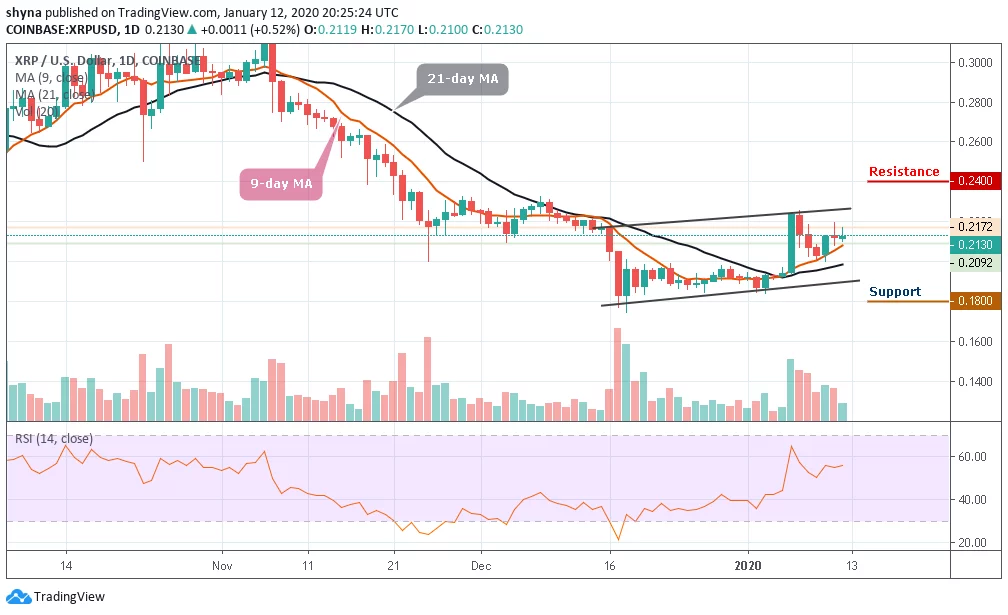
XRP/USD is making an attempt to keep its upward movement as the buyers struggle to move the cryptocurrency to a new height.
XRP/USD Market
Key Levels:
Resistance levels: $0.24, $0.25, $0.26
Support levels: $0.18, $0.17, $0.16
XRP/USD has been increasing slowly since January 9, earning around 0.52% during the negotiation today. Looking at the daily chart, Ripple (XRP) has been dropping after a bullish rally that occurred on January 6. At the moment, the bulls are making an attempt to control the market with a current movement above the 9-day and 21-day moving averages, which is heading towards the resistance level of $22.
However, XRP remains the third-largest cryptocurrency with a market cap of $9.2 billion. The Ripple price has seen a slight increase in the market over the past 24 hours and it is currently trading around $0.21. For now, XRP/USD may likely begin a sideways movement before any breakout or break down of the ascending channel
Moreover, should in case the price breaks out of the channel, the resistance levels of $0.24, $0.25 and $0.26 could be visited. Meanwhile, for a backward movement, the market can be supported at levels of $0.18 and $0.17 and if the price falls below the previous levels, another support is around $0.16 while the RSI indicator is moving in the same direction below the 60-level.
As far as Bitcoin is concerned, XRP is currently changing hands at 2616 SAT and it’s trading under the 9-day and 21-day moving averages. If the above-mentioned level can serve as the market support, the price may likely face the north and the key resistance lies at 2700 SAT. By reaching this level, the bulls could move the price to 2800 SAT and 2900 SAT resistance levels.
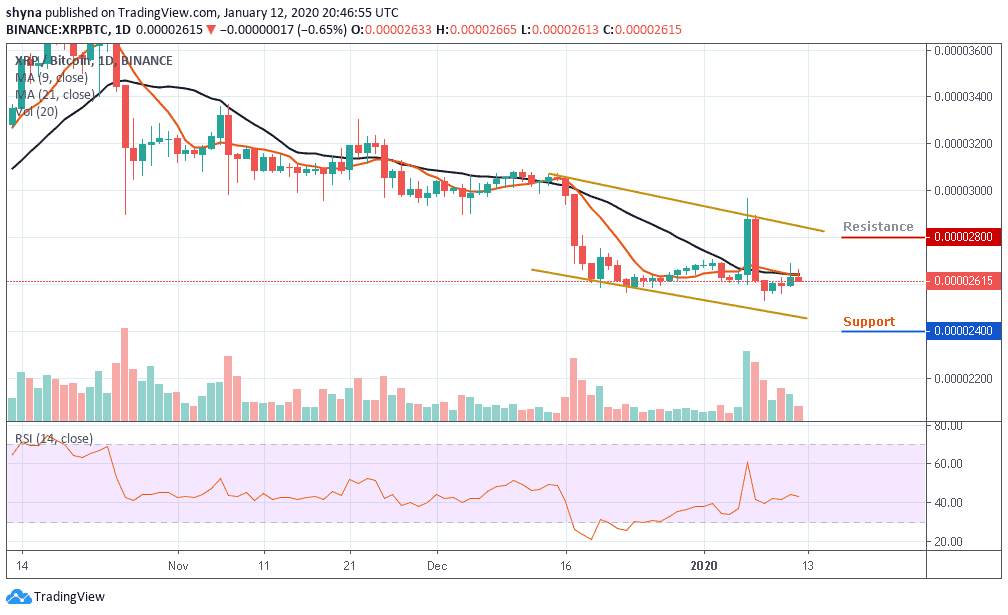
However, if the bulls fail to push the price to the nearest resistance, the market may continue its downtrend and the pair could probably record further declines at 2500 SAT. Breaking this level could further push the market to the nearest support levels, at 2400 SAT and below as the trend line of RSI (14) moves above the 40-level.
Please note: Insidebitcoins.com is not a financial advisor. Do your research before investing your funds in any financial asset or presented product or event. We are not responsible for your investing results.
Join Our Telegram channel to stay up to date on breaking news coverage