Join Our Telegram channel to stay up to date on breaking news coverage
ETH Price Prediction – January 12
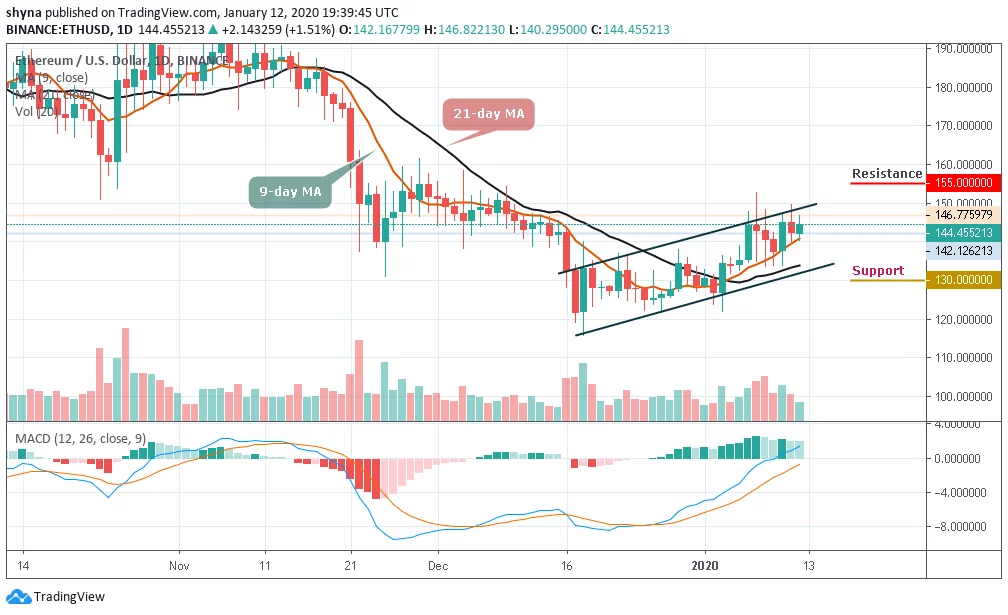
In the past few days, Ethereum surges from $137 to $149 and then drops to $144. ETH/USD may likely cross $150 by next week.
ETH/USD Market
Key Levels:
Resistance levels: $155, $157, $159
Support levels: $130, $128 $126
ETH/USD has been consolidating within the ascending channel for the past few days. For now, ETH/USD is currently trading at $144.45 but still trading above the 9-day and 21-day moving average. At the opening of the market today, the daily chart shows that the price first went up to $146.77, where it met resistance and later fell to $142.12 support level where it began to correct itself.
However, in the early hours of today, the bulls have regained control of the market. A couple of days ago, trading has been a resounding victory for the bulls as Ethereum’s price jumped up, breaking above the 9-day and 21-day moving averages. Looking at the daily chart, the daily breakdown shows us that ETH/USD is still following an uptrend.
In other words, for a backward movement, the market can be supported by $130 and $128 levels, if the price falls below the previous levels; another support is around $126. But should in case the price exceeds the indicated level by breaking above the channel, the resistance levels of $155, $157 and $159 may be visited. The MACD signal lines are about crossing to the positive side, which may likely give more support to the bulls.
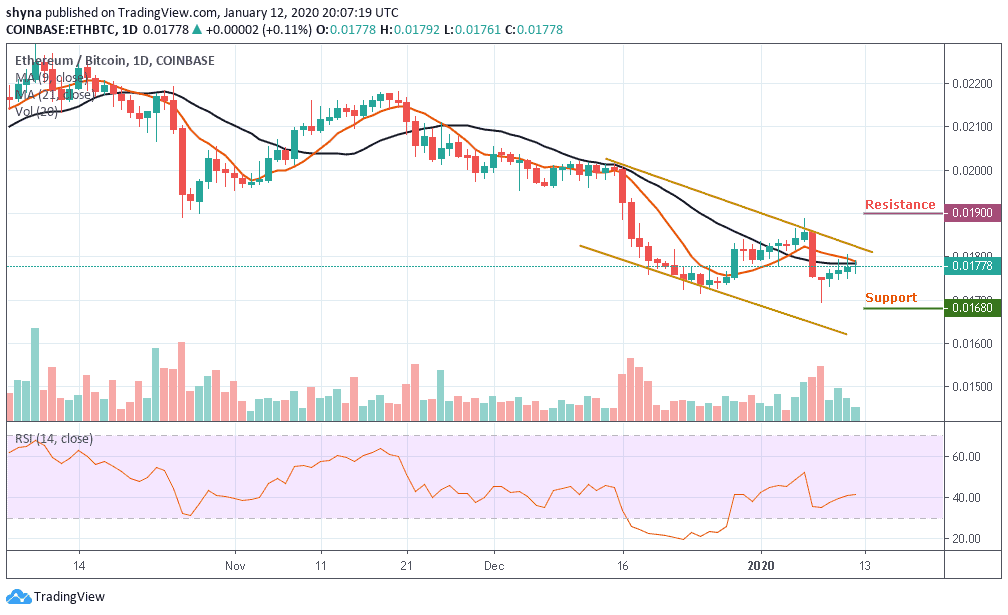
Against Bitcoin, Ethereum (ETH) is currently changing hands at 1778 SAT after witnessing about four consecutive green candles in the last few days. Looking at the daily chart, the current trend of the coin is perpetually looking bullish in the short-term, moving towards the 9-day and 21-day moving within the descending channel.
Meanwhile, the resistance levels to look for are 1900 SAT and 1950 SAT while the closest support levels to keep an eye on are 1680 SAT and potentially 1630 SAT. The RSI (14) moves above level 40, which may likely give more bullish signals in the nearest term.
Please note: Insidebitcoins.com is not a financial advisor. Do your research before investing your funds in any financial asset or presented product or event. We are not responsible for your investing results.
Join Our Telegram channel to stay up to date on breaking news coverage