Join Our Telegram channel to stay up to date on breaking news coverage
BCH Price Prediction – January 11
Bitcoin Cash (BCH) is still trading within the ascending channel despite the fact that the technical indicator shows increasing bullish sentiment.
BCH/USD Market
Key Levels:
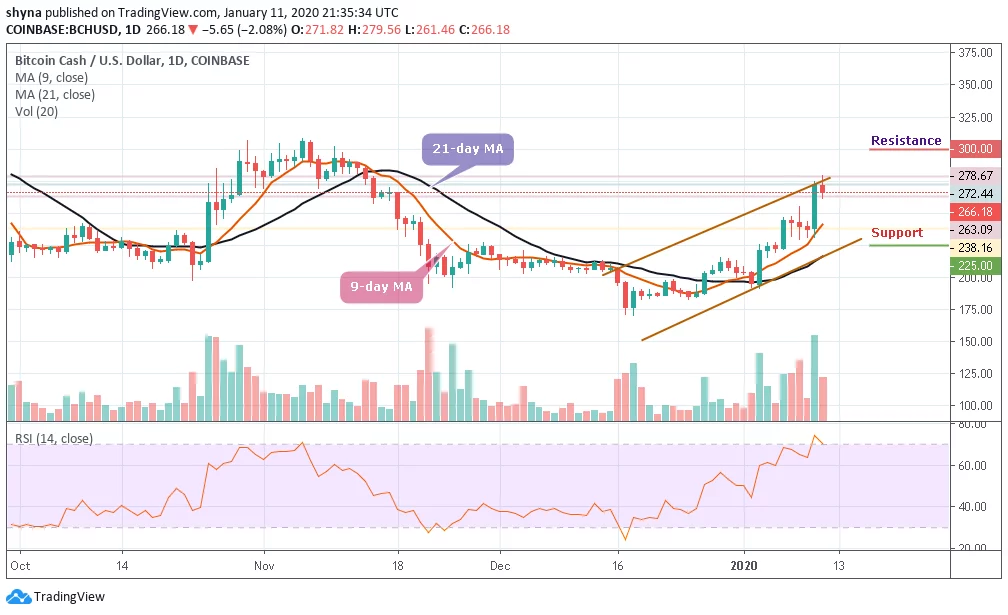
Resistance levels: $300, $335, $340
Support levels: $225, $220, $215
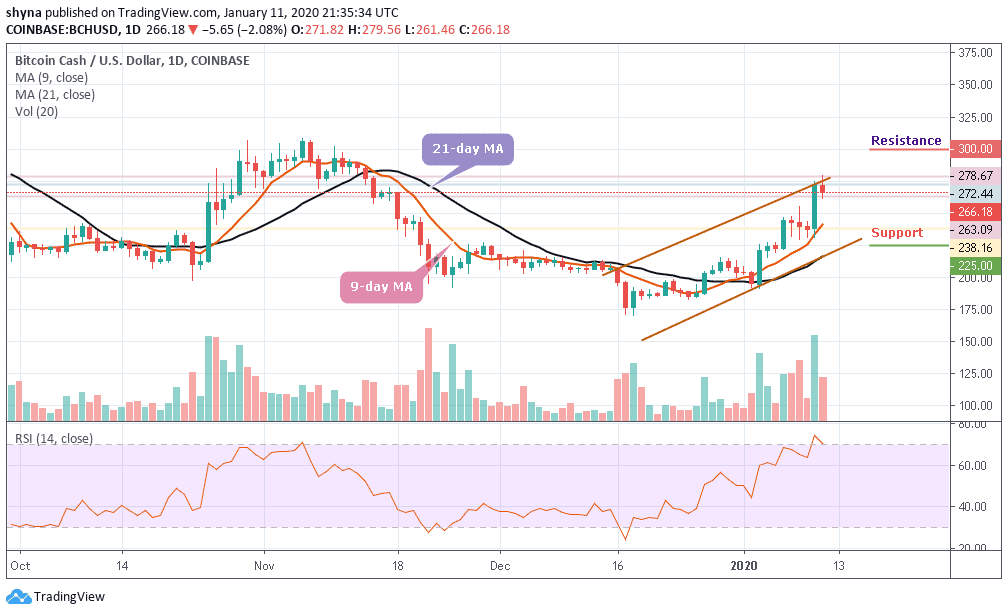
In the early hours of yesterday, BCH/USD climbed from $238.16 to $272.44. It actually managed to go all the way up to $268, trending above the $270 level for the first time since November 6, before facing bearish correction. The price is trading around the upper boundary of the channel. Both the 9-day and 21-day MAs shows increasing bullish sentiment.
Looking at the chart, BCH/USD is changing hands at $266.18 and if the market price drops further, the coin could slump below the moving averages to reach the support levels of $225, $220 and $215, bringing the price to cross below the channel. Meanwhile, a strong buying pressure may take the price to the resistance level of $280.
However, while trading at $290, a bullish continuation may likely the price to $300, $335 and $340 resistance levels. Whereas, the RSI (14) indicator is trending at the edge of the overbought zone, indicating that more bearish corrections may come to play.
BCH/BTC Market
Meanwhile, compared with Bitcoin, when looking at the daily chart, following the trade for the past few weeks, the bulls have shown a great commitment to BCH trading. Following the recent positive sign, the trend may continue to go up if the buyers can sustain the pressure further.
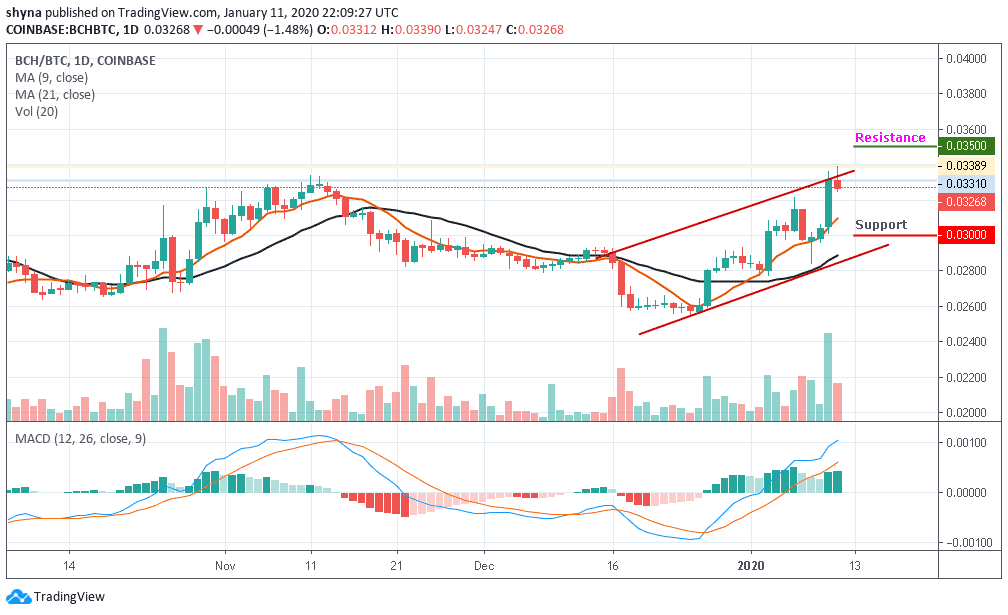
However, if the bulls succeeded in breaking the upper side of the channel, the market price may likely reach the next resistance level of 3500 SAT and 3600 SAT. In other words, a retest could allow the pair to go below the 9-day moving average and lower the price to 3000 SAT and 2900 SAT support levels. With the look of things, the MACD signal lines have crossed into the positive side which could boost the bullish movement.
Please note: Insidebitcoins.com is not a financial advisor. Do your research before investing your funds in any financial asset or presented product or event. We are not responsible for your investing results.
Join Our Telegram channel to stay up to date on breaking news coverage