
Join Our Telegram channel to stay up to date on breaking news coverage
Ripple Price Prediction – August 18
The Ripple price prediction launches the bullish trend after testing the support level of $1.08 a few days ago.
XRP/USD Market
Key Levels:
Resistance levels: $1.40, $1.45, $1.50
Support levels: $0.85, $0.80, $0.75
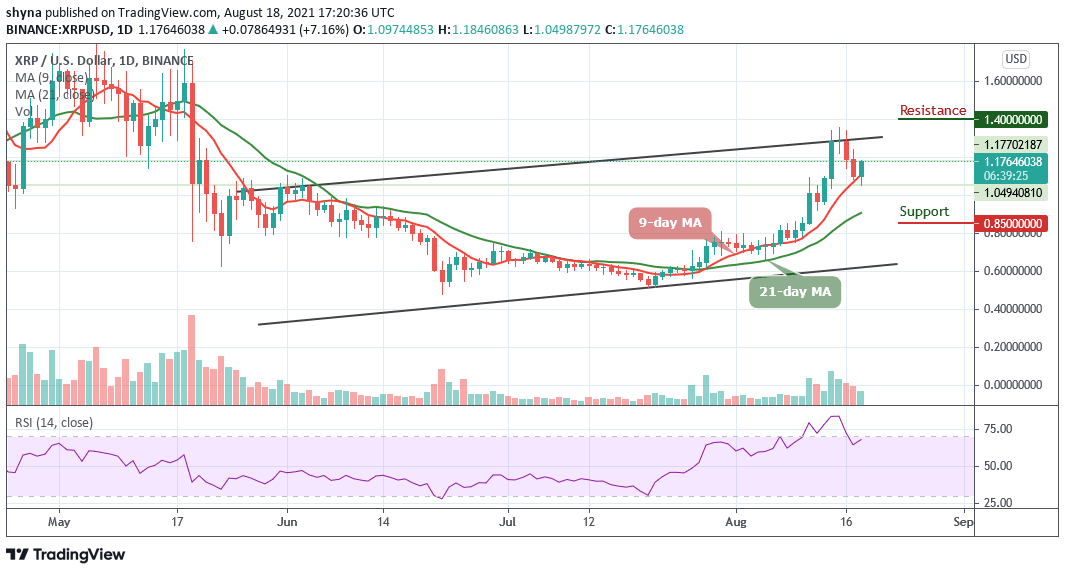
XRP/USD is currently following an upward movement after sliding below $1.05 to test support at the $1.04 level. Currently, XRP/USD is changing hands at $1.17, having gained over 7% after touching the low of $1.04. At the time of writing, the coin remains above the 9-day and 21-day moving averages as Ripple (XRP) now takes sixth place in the global cryptocurrency market rating, with the current market capitalization of $54.32 billion.
Ripple Price Prediction: Ripple Price Needs to Break Above the Channel
The Ripple price is moving towards a $1.20 resistance level as an initial break above the 9-day moving average boosted the price further up. The Ripple (XRP) faces a high above $1.15 before it could retreat back below the current price level. From the upside, more highs may come into play and the nearest resistance level is located at $1.25 while the potential resistance levels could be found at $1.40, 1.45, and $1.50.
However, the trend remains in the hands of the bulls supported by the technical indicator where the Relative Strength Index (14) is almost crossing into the overbought region, building on the consistent recovery from the downside recorded a few days ago. Meanwhile, a break above the $1.20 resistance level may most likely push the coin above the potential $1.30 resistance level but a break below the moving averages may lead to the supports at $0.85, $0.80, and $0.75 respectively.
When compares with Bitcoin, the Ripple price keeps moving around 2506 SAT above the 9-day and 21-day moving averages. After the coin touches the daily high at 2606 SAT today, the coin is now retreating back to where it is currently trading. Meanwhile, the bearish scenario may come to play if the sellers put pressure on the market.
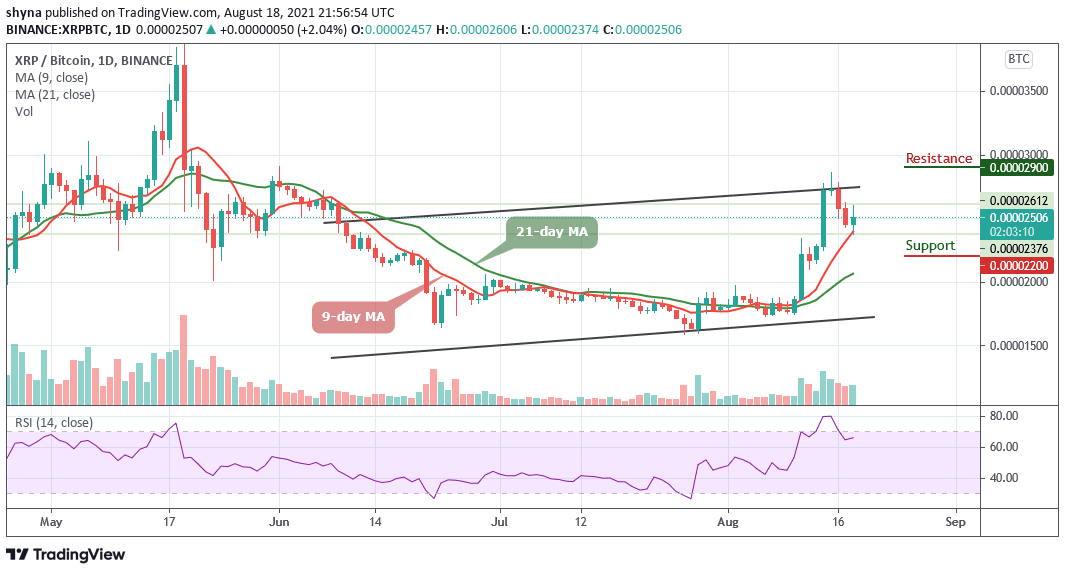
However, if the coin cross below the 9-day moving average, XRP/BTC may drop to 2200 SAT and below. Presently, the technical indicator Relative Strength Index (14) moves above 65-level as the market remains at the upper side of the channel where the bulls can easily push the coin towards the resistance level at $2900 and above.
Looking to buy or trade Ripple (XRP) now? Invest at eToro!
75% of retail investor accounts lose money when trading CFDs with this provider
Join Our Telegram channel to stay up to date on breaking news coverage
