Join Our Telegram channel to stay up to date on breaking news coverage
Ripple Price Prediction – August 16
The Ripple price is hovering at $1.26 as it lacks imminent support and therefore, trades in the red with dense selling pressure.
XRP/USD Market
Key Levels:
Resistance levels: $1.50, $1.60, $1.70
Support levels: $1.15, $1.05, $0.95
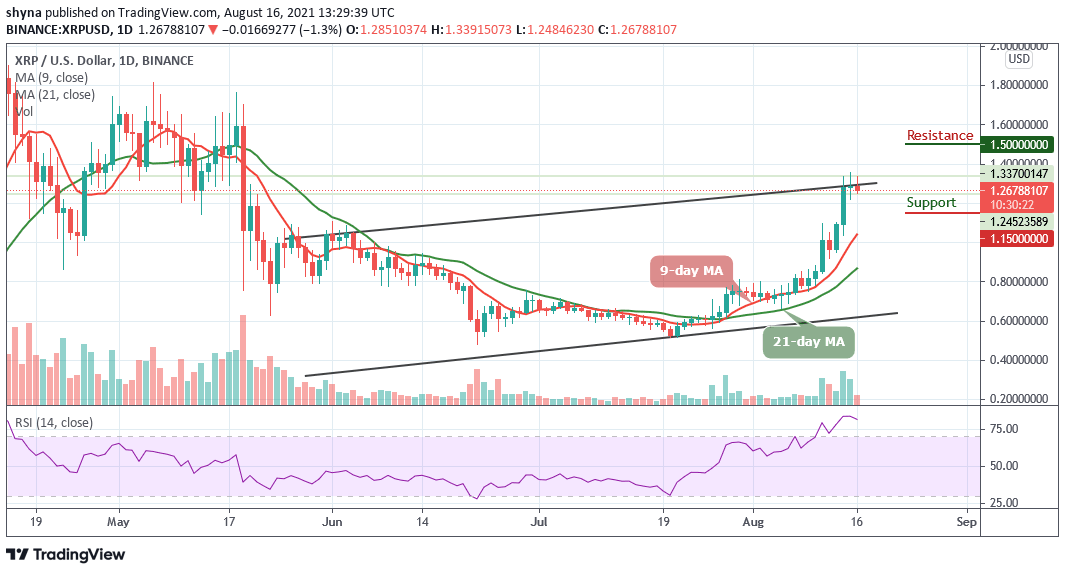
XRP/USD is now down at a low of $1.24 and the weakness of Ripple (XRP) is quite apparent now as the digital asset may have very little support on the way down to $1.00. However, traders should take note that most of the market is also seeing red numbers, major coins have been holding on quite well. Therefore, XRP/USD may see a bounce from any support level to have any chance to recover its daily uptrend.
Ripple Price Prediction: Ripple Price May Break to the Downside
Looking at the daily chart, if the Ripple price fails to climb above the upper boundary of the channel, there could be a bearish reaction. At the moment, the initial support is near $1.20. Therefore, if there is a downside break below this level, the Ripple price could test at $1.16. However, any further losses might start another bearish wave and the price could even decline below the $1.15, $1.05, and $0.95 support levels.
However, as the technical indicator reveals, the Relative Strength Index (14) stays within the overbought region to keep the coin at the upside. However, if the bulls put more effort, the coin could hit the nearest resistance level at $1.40 level and this bullish movement may also reach the potential resistance levels at $1.50, $1.60, and $1.70 respectively.
Against Bitcoin, the Ripple price is now moving below the upper boundary of the channel after touching the daily high of 2786 SAT. However, if the selling pressure resumes, the Ripple price variation may create a new low at 2500 SAT. Therefore, the technical indicator Relative Strength Index (14) which is still within the overbought region is signaling a bearish movement.
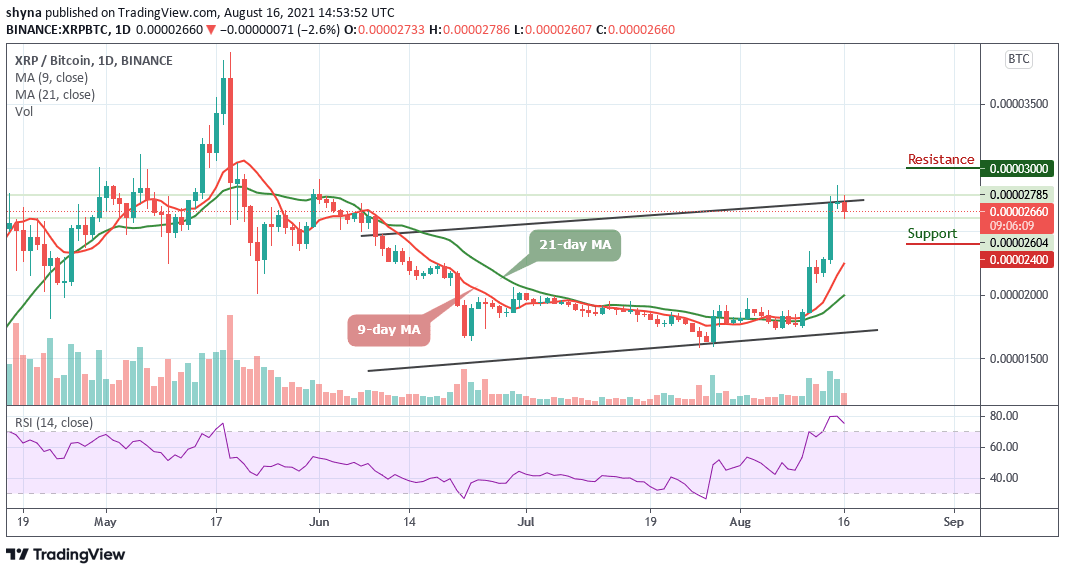
Moreover, the Ripple price is currently hovering at 2660 SAT. Therefore, the coin may likely hit the critical support at 2400 SAT after which it could break to another support at 2300 SAT and 2200 SAT. Meanwhile, if a bullish movement occurs and pushes the Ripple price above the upper boundary of the channel; it could hit the potential resistance at 3000 SAT and above.
Looking to buy or trade Ripple (XRP) now? Invest at eToro!
75% of retail investor accounts lose money when trading CFDs with this provider
Join Our Telegram channel to stay up to date on breaking news coverage