Join Our Telegram channel to stay up to date on breaking news coverage
XRP Price Prediction – May 14
The Ripple price is trading in the positive territory, with gains of some 0.44%.
XRP/USD Market
Key Levels:
Resistance levels: $0.24, $0.25, $0.26
Support levels: $0.15, $0.14, $0.13
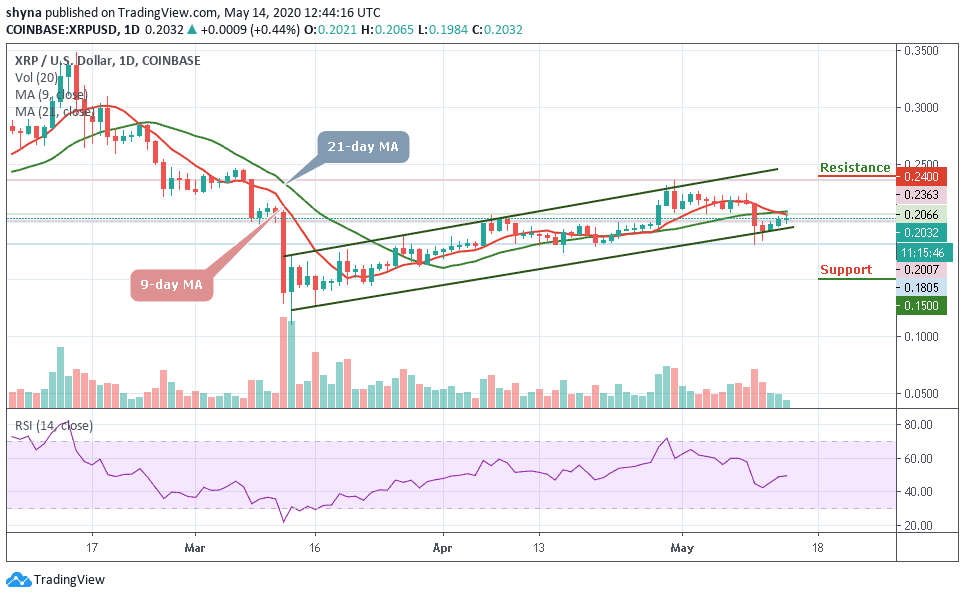
XRP/USD moves from $0.200 in a matter of hours to touch an intraday high at $0.206. While the coin has retreated to $0.203 at the time of writing, the pair retains bullish momentum. In the short term, XRP/USD has gained more than 0.44% within 24 hours. Meanwhile, the bulls needed a daily break and closure above the 9-day and 21-day moving averages to invite greater buying momentum.
At the moment, the price of the coin is changing hands at $0.203 level and the bulls are still pushing the price towards the north. But if the Ripple (XRP) fails to continue above the $0.205 resistance level, there might be another decline below the moving averages to break down the lower boundary of the channel. The initial support is near the $0.180 level, if this support level fails to contain the sell-off, the price may then be pushed to other support levels of $0.15, $0.14, and $0.13.
Moreover, the technical indicator RSI (14) is moving around 49.06-level which still confirms the bullish trend that may take the coin to the nearest resistance level of $0.22, further resistance could be found at $0.24, $0.25 and $0.26 levels before the market is free to make another attempt at $0.28 level.
When compared with Bitcoin, XRP is currently trading on the downside. If the selling pressure persists, the Ripple price variation may likely create a new low in the coming days. For now, the RSI (14) is within the oversold zone; we may see a negative move in the market soon.
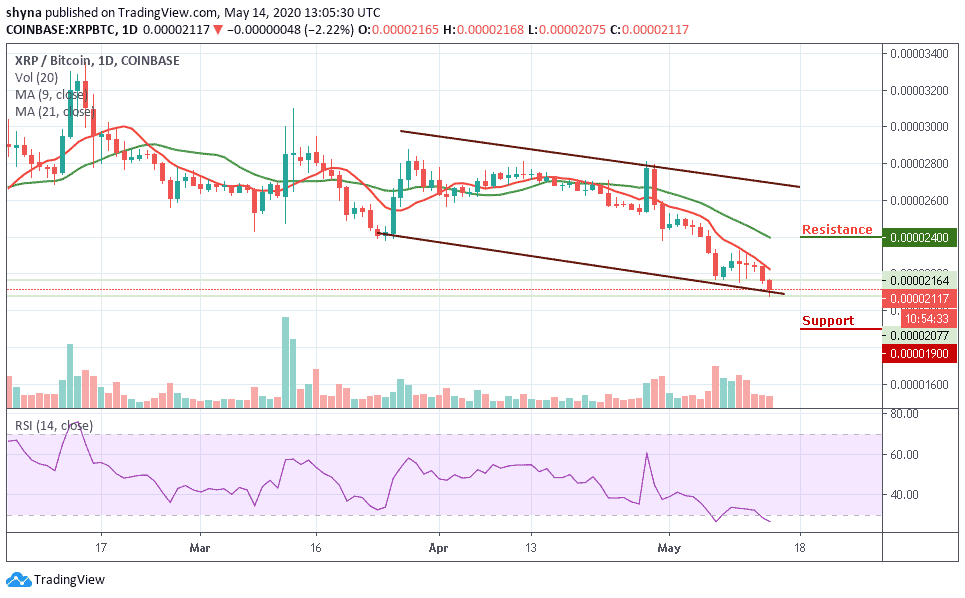
However, the coin is currently trading below the 9-day and 21-day moving averages at 2117 SAT. We can expect close support at the 1900 SAT before breaking to 1800 SAT and critically 1700 SAT levels. If a bullish move occurs and validates a break above the moving averages; we can then confirm a bull-run for the market and the closest resistance levels lie at 2400 SAT and above.
Please note: Insidebitcoins.com is not a financial advisor. Do your research before investing your funds in any financial asset or presented product or event. We are not responsible for your investing results.
Join Our Telegram channel to stay up to date on breaking news coverage