Join Our Telegram channel to stay up to date on breaking news coverage
Bitcoin (BTC) Price Prediction – May 14
The price of Bitcoin is seen trading nicely above the $9,900 and the coin must reach the $10,000 resistance to continue higher.
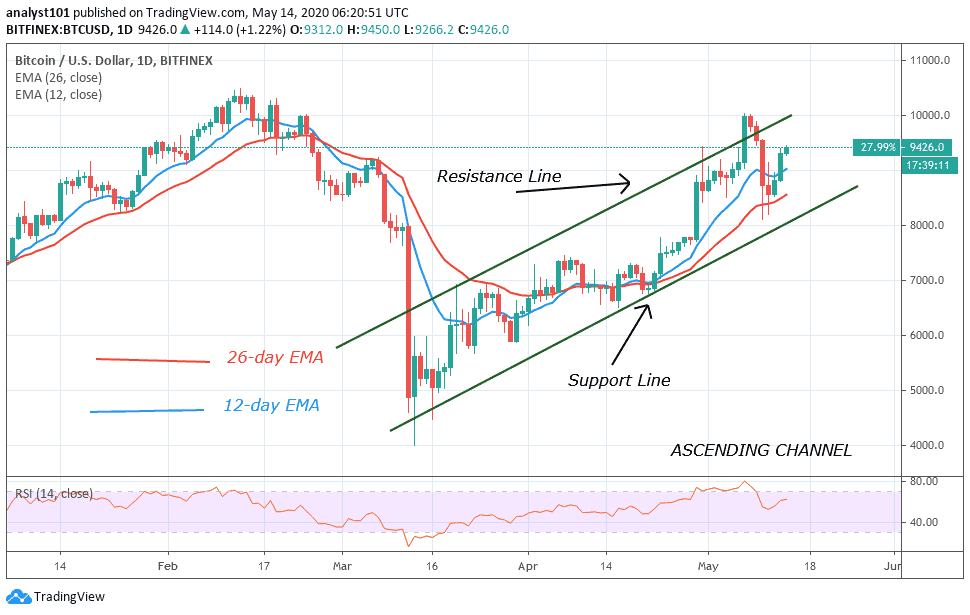
BTC/USD Long-term Trend: Bullish (Daily Chart)
Key levels:
Resistance Levels: $11,500, $11,700, $11,900
Support Levels: $8,200, $8,000, $7,800
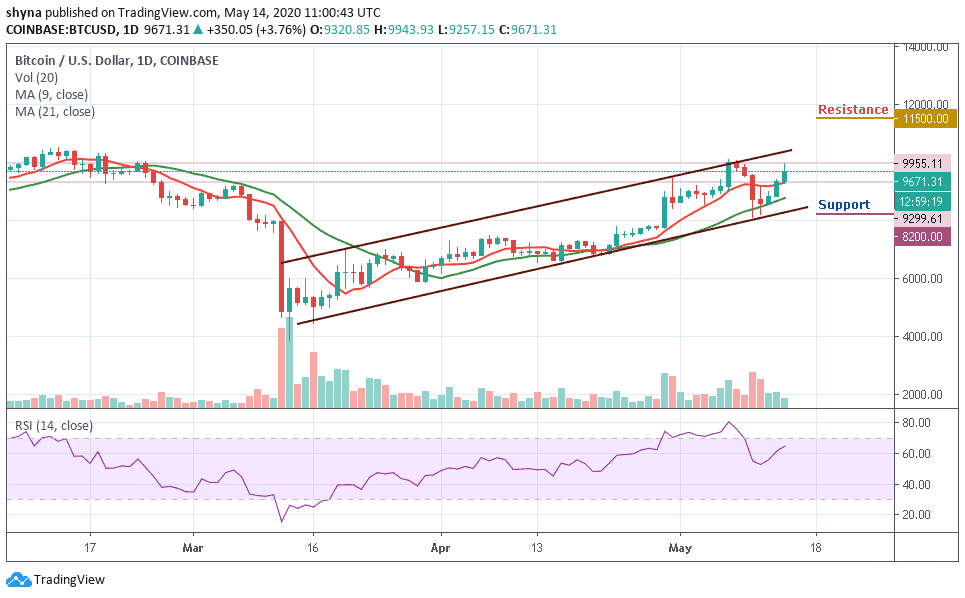
BTC/USD bulls are gradually coming back into action after a minor battering from the bears a few days ago. Today, as the coin touches the resistance level of $9,955.11 in the early trading hours of the day, the coin is seen quickly pulling back to where it is trading currently at $9,671 and may continue to head upwards if the bulls maintaining the trend.
Nevertheless, the market is now deciding above the 9-day and 21-day moving averages, where the buyers are anticipating a clear breakout above the ascending channel. Meanwhile, the $10,500 and $11,000 levels may further surface as the key resistances should the $10,000 level come to play. However, a strong bullish spike may take the price to $11,500, $11,700, and $11,900 levels.
Moreover, if the market makes a quick turn below the moving averages, the Bitcoin price could drop to $8,500, and should this support fails to contain the sell-off; traders may see a further roll back to $8,200, $8,000 and critically $7,800. The technical indicator RSI (14) suggests an upward movement for the coin as it moves toward the overbought zone.
BTC/USD Medium-Term Trend: Bullish (4H Chart)
The 4-hour chart for BTC is looking bullish; the market is now showing a positive movement since the market opens today. However, the intraday trading is now giving a bullish confirmation as the technical indicator RSI (14) also moves into the overbought zone. More so, a climb above $10,000 resistance level may further push the BTC price to the potential resistance levels at $10,500, $10,700, and $10,900.
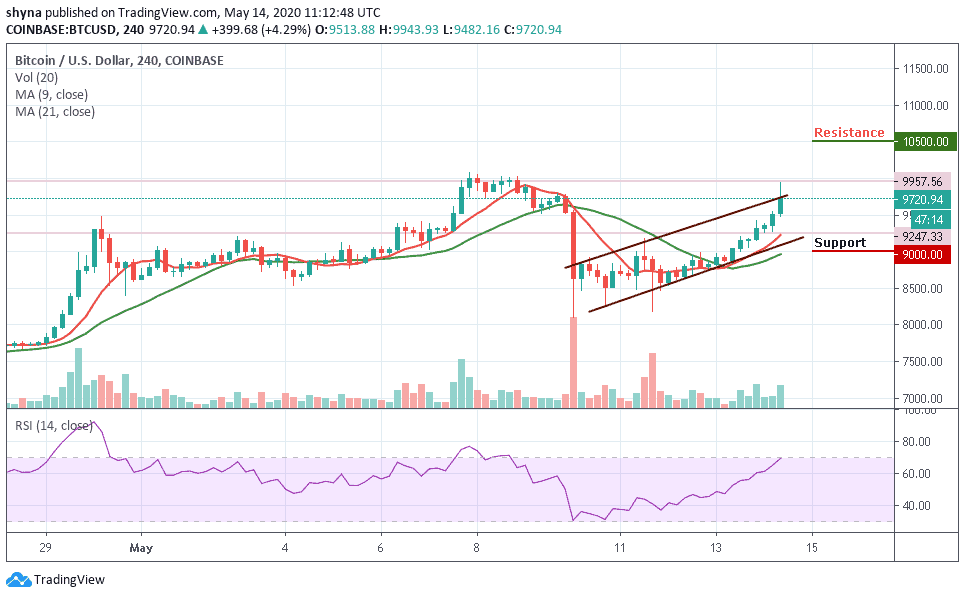
However, if the technical indicator gets into the overbought condition, the sellers are likely to emerge and push the price downward. Any bearish movement may likely hit the supports at $9,000, $8,800, and $8,600 respectively.
Please note: Insidebitcoins.com is not a financial advisor. Do your research before investing your funds in any financial asset or presented product or event. We are not responsible for your investing results.
Join Our Telegram channel to stay up to date on breaking news coverage