Join Our Telegram channel to stay up to date on breaking news coverage
XRP Price Prediction – November 20
As of now, Ripple (XRP) is aiming to fall again, but the key support is becoming a threat to the sellers.
XRP/USD Market
Key Levels:
Resistance levels: $0.28, $0.29, $0.30
Support levels: $0.22, $0.21, $0.20
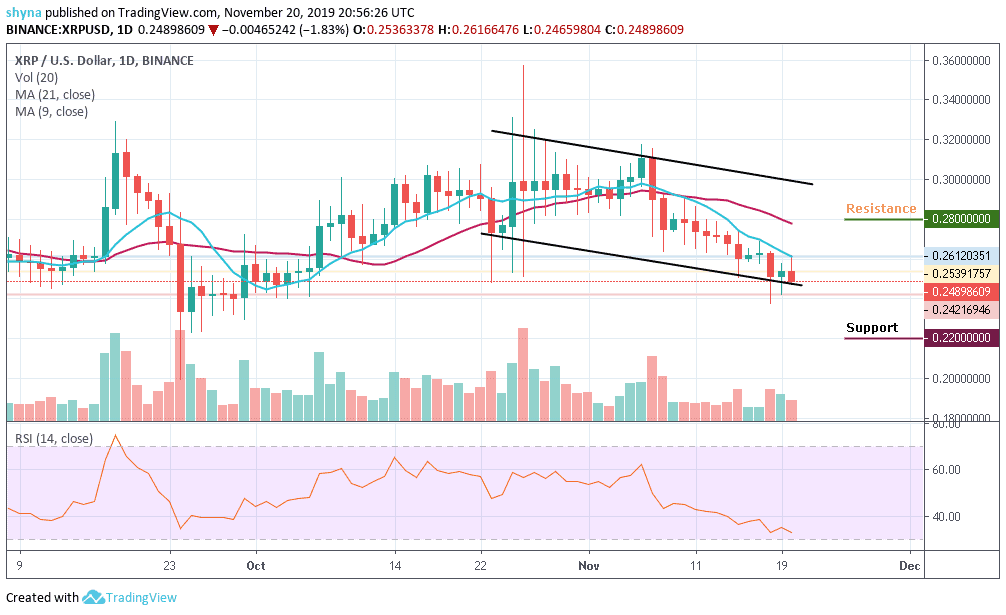
The last few days have been tough for many cryptocurrencies, including XRP. Ripple remained depressed after the slide on Friday. The last weekend session was characterized by a weak trading activity leading to a consolidation between $0.26 and $0.27. XRP/USD, however, resumed the downtrend on Monday as it explored below the support level of $ 0.25. Lower levels at $0.24 were tested before a superficial reversal was allowed above $0.26.
However, Ripple’s current fall has been brought by the market-wide struggle and it is likely to stay here for some more days. The current trend is at the lower side of 9 days and 21 days moving averages, which hints towards XRP’s upcoming surge. Following the path of all other coins, Ripple also has made a cut of 1.83% in the last 24 hours and the value has fallen to $0.24 now.
As at now, the price is bearish but a bounce back to $0.28, $0.29 and $0.30 resistance levels may once again give strength to the $0.24. If this support gets weak, a price break-down may occur as the bears may find a new monthly low at $0.22, $0.21 and $0.20 support levels. In the long run, Ripple’s XRP remains in a dominant downtrend. The chart’s volume is also showing a high negative amount of bars.
The RSI (14) heads towards the oversold zone. If the price oscillates downward, XRP may continue falling.
Against Bitcoin, the Ripple (XRP) is still moving in sideways as the price trades within the 9-day and 21-day moving averages. Now, the bear appears to be stepping back in the market, and we may expect the price-drop to 2922 SAT and 282 SAT support levels. But as at the time of writing, XRP/BTC is changing hands at 3082 SAT.
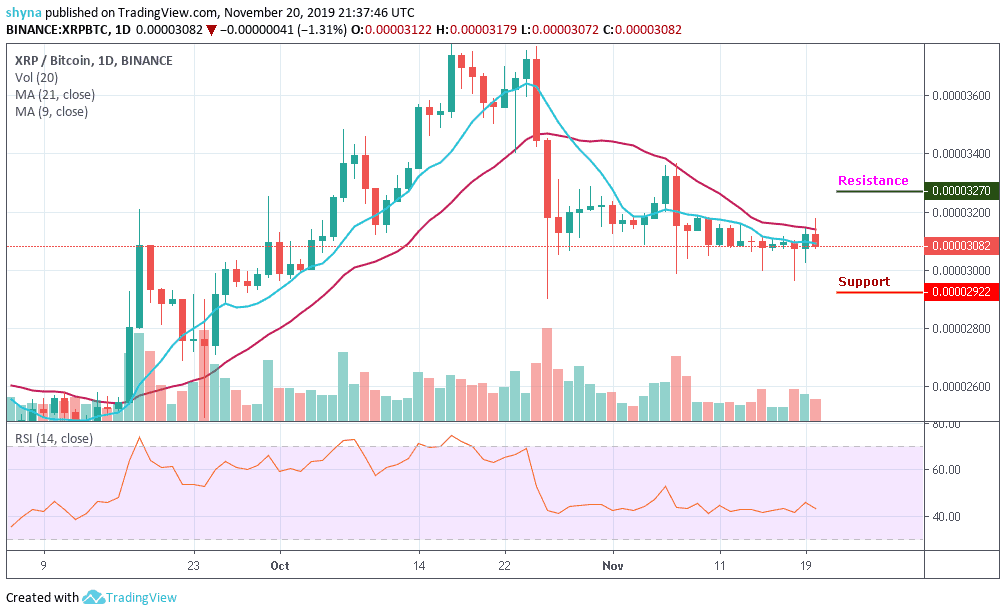
Moreover, if the buyers make an attempt to push the price above the current 3082 SAT, the next level of resistance is located at 3200 SAT and more resistance is found at 3270 SAT and 3370 SAT. The RSI (14) moves in the same direction as the market remains indecisive.
Please note: Insidebitcoins.com is not a financial advisor. Do your research before investing your funds in any financial asset or presented product or event. We are not responsible for your investing results.
Join Our Telegram channel to stay up to date on breaking news coverage