Join Our Telegram channel to stay up to date on breaking news coverage
XRP Price Prediction – January 6
In the last 24 hours, Ripple (XRP) has gained more than 13.6% and the next resistance level may be at $0.230.
XRP/USD Market
Key Levels:
Resistance levels: $0.24, $0.25, $0.26
Support levels: $0.18, $0.17, $0.16
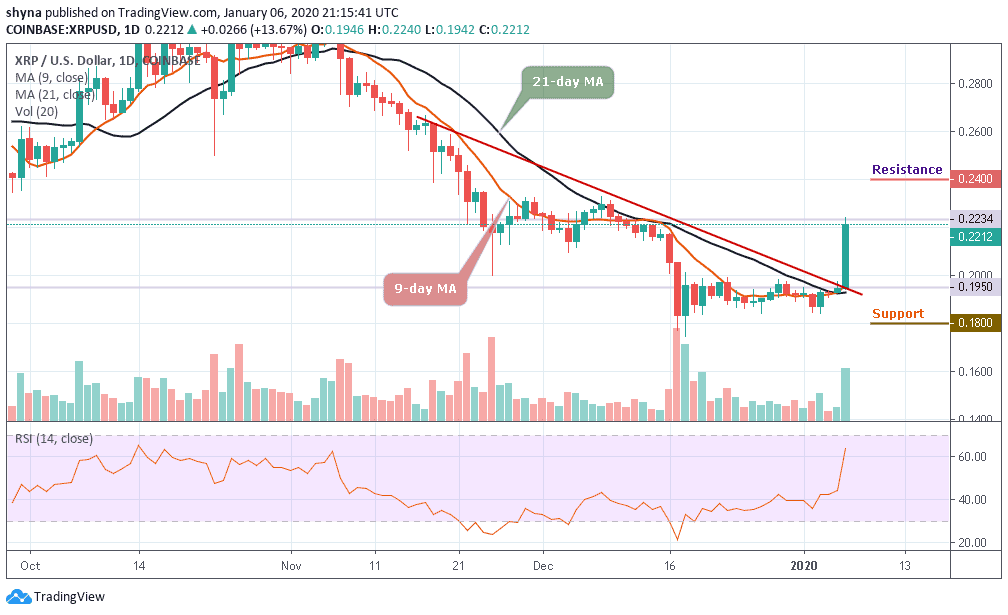
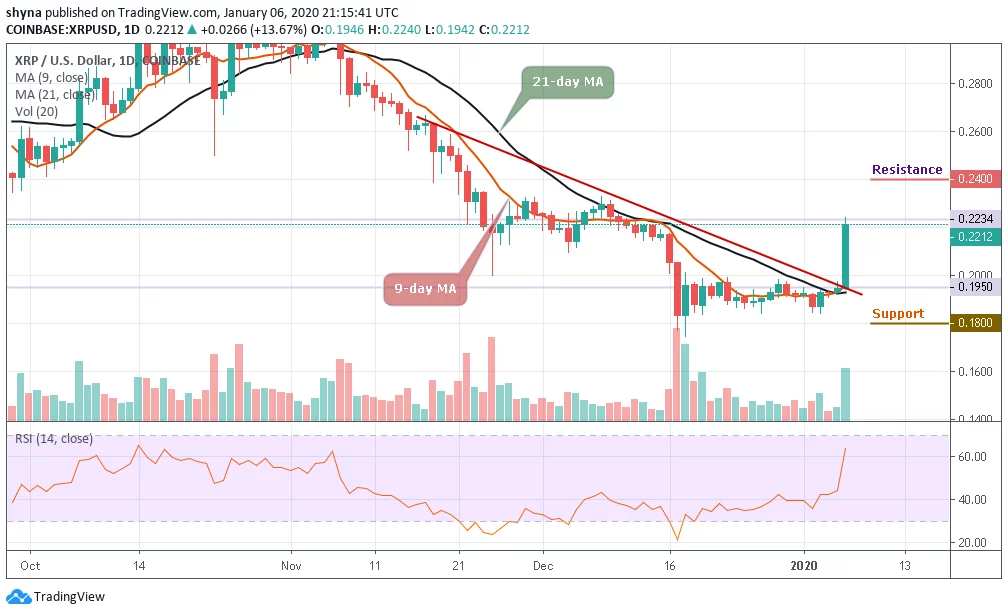
Today, XRP/USD jumped from $0.195 to the area above $0.220 in a matter of hours and touched an intraday high at $0.223. While the coin has retreated to $0.221 at the time of writing, the pair retains bullish momentum. In the short term, XRP/USD has gained more than 8.25% in the last 24 hours and 5.5% since the beginning of the day. Currently, it is the best-performing coin out of the top 10.
Meanwhile, due to a strong upside movement of the coin, Ripple’s XRP broke free from the recent range and tested the highest level since last month December 18, 2019. The descending trend line at $0.195 now serves as strong support for the coin. If it is broken, the sell-off may be extended to $0.170.
Currently, the price of the coin is changing hands at $0.221 level and the bulls are still following the uptrend. If the price moves below moving averages of 9 days and 21 days to cross below the trend line, the coin may likely visit the support level of $0.18, $0.17 and $0.16.
Moreover, the RSI (14) moves above the 60-level heading towards the overbought condition, which could give more bullish signals as further movement may take the market to the nearest resistance levels of $0.24, $0.25 and $0.26 respectively.
Against BTC, Ripple (XRP) is demonstrating some positive signs across the market. The trend is perpetually looking bullish in the long-term while crossing the upper boundary of the descending channel. It is currently changing hands at 2821 SAT after witnessing some sideways movement last week.
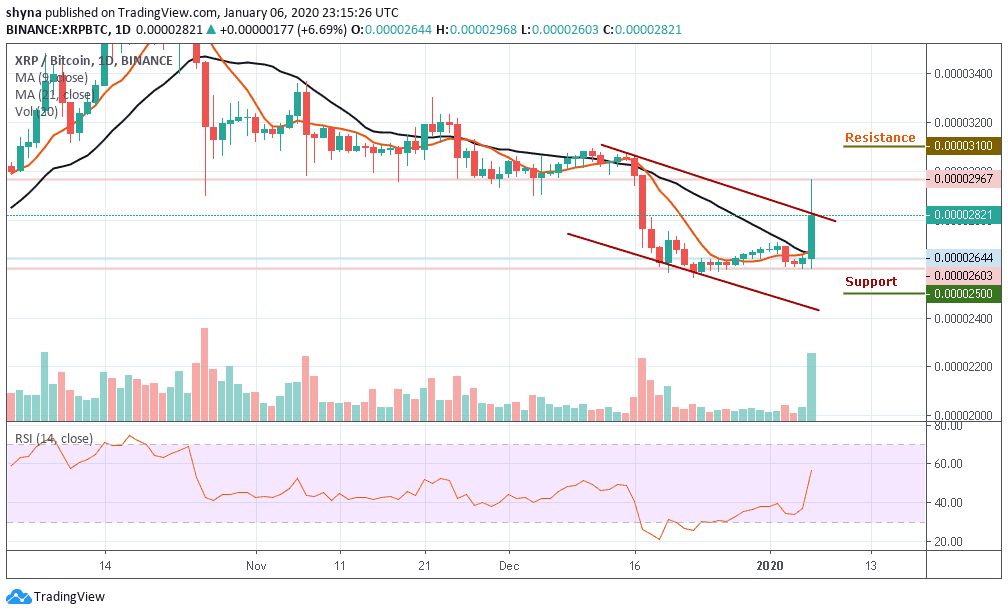
The resistance levels to look for are 3100 SAT, 3200 SAT and 3300 SAT while the closest support levels to keep an eye on are 2500 SAT, 2400 SAT, and potentially 2300 SAT. The technical indicator RSI (14) is moving towards the 60-level, indicating more bullish signals for a while.
Please note: Insidebitcoins.com is not a financial advisor. Do your research before investing your funds in any financial asset or presented product or event. We are not responsible for your investing results.
Join Our Telegram channel to stay up to date on breaking news coverage