Join Our Telegram channel to stay up to date on breaking news coverage
Ripple Price Prediction – June 14
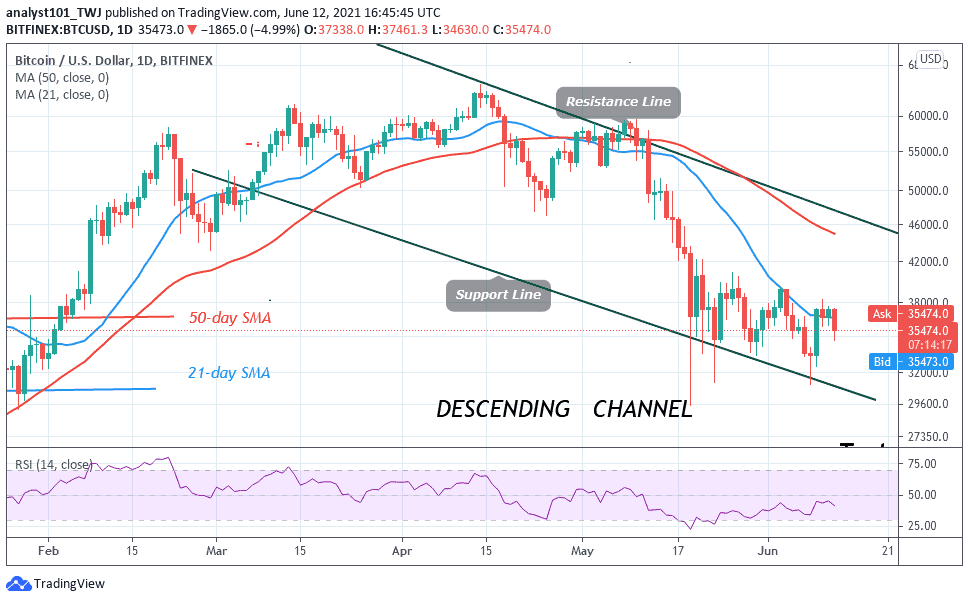
Ripple (XRP) may experience more potential damage as the price consolidates in a tight range.
XRP/USD Market
Key Levels:
Resistance levels: $1.25, $1.35, $1.45
Support levels: $0.62, $0.52, $0.42
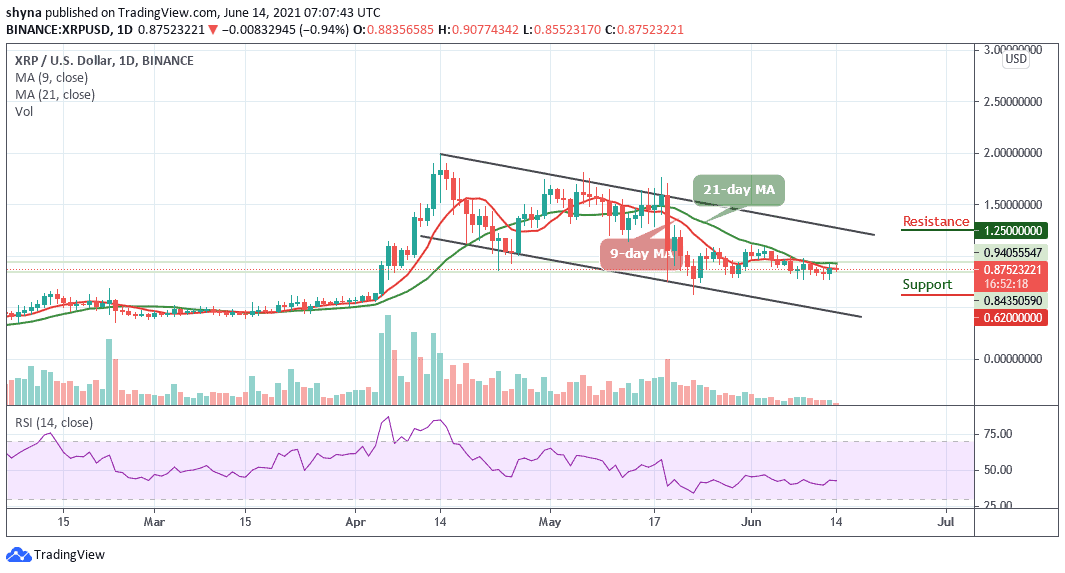
XRP/USD is seen consolidating within the channel and has been range-bound recently. The Ripple price faced stiff resistance on approach to psychological $0.98 and it is trading at $0.87 at the time of writing. Since the beginning of today’s trading, XRP/USD loses 0.94% on a day-on-day basis after touching the $0.90 resistance level.
Ripple Price Prediction: Price May Break to the Downside
At the moment, the Ripple price is following a sideways movement as the coin begins to experience a price drop in the market. Nevertheless, after touching the $0.90 level today, XRP/USD has been waiting for a break above the 9-day and 21-day moving averages to the upside, but with the appearance of the chart, it might not come into play as revealed by the technical indicator.
However, the Ripple price is moving within the channel and around the 9-day moving average. More so, should in case the bulls push the price upward, it may likely reach the resistance at $1.25, $1.35, and $1.45 resistance levels, otherwise, there is a possibility of it getting to the support levels at $0.62, $0.52, and $0.42 respectively while the Relative Strength Index (14) is moving in the same direction above 40-level.
Comparing it with Bitcoin, the Ripple price breaks down significantly to touch the lower boundary of the channel. The market price falls to touch 2207 SAT and the signal line of RSI (14) is found moving towards 35-level, which might be considered as a downward movement.
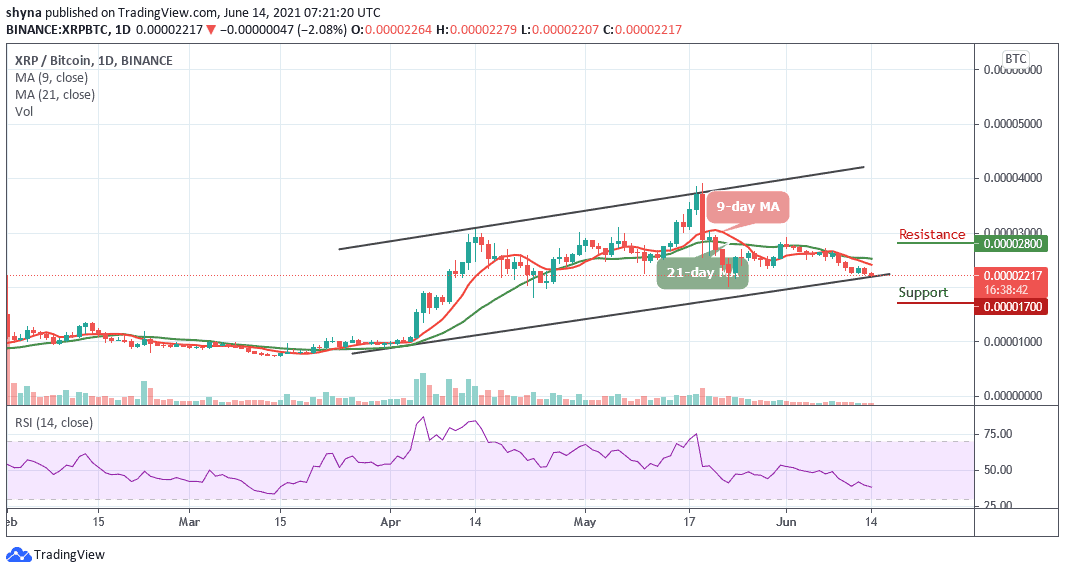
Furthermore, the market may continue to decline if the sellers put more effort to bring it down to the support levels of 1700 SAT, 1500 SAT, and 1300 SAT. Therefore, on the other hand, the Ripple price is likely to go up to touch the resistance levels of 2800 SAT, 3000 SAT, and 3200 SAT if the technical indicator turns upward to introduce a new trend for the coin.
Join Our Telegram channel to stay up to date on breaking news coverage