Join Our Telegram channel to stay up to date on breaking news coverage
XRP Price Prediction – January 10
The Ripple (XRP) has been losing ground since January 8 but the bulls are in retreat as the price hovers around $0.200.
XRP/USD Market
Key Levels:
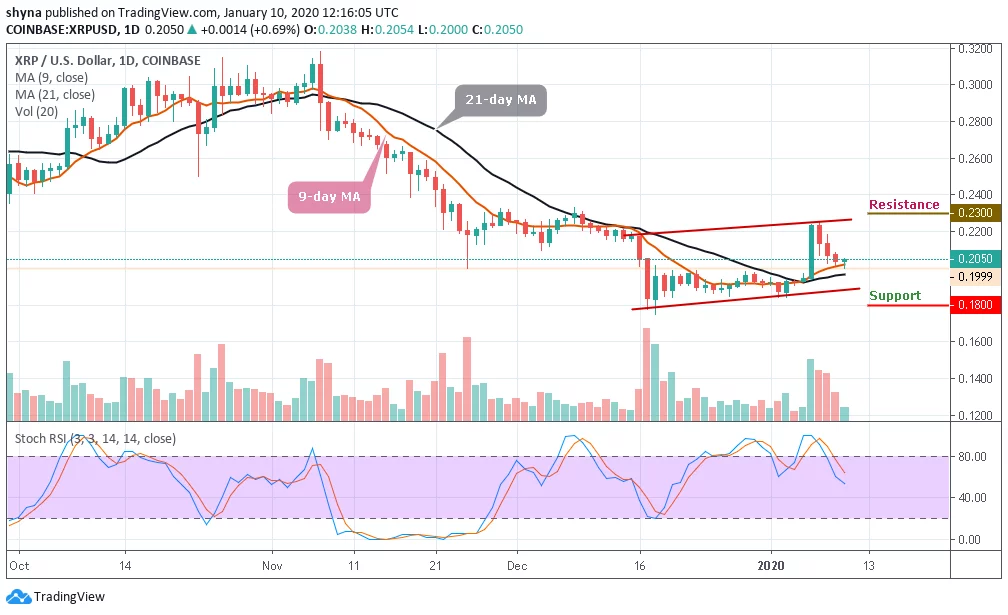
Resistance levels: $0.230, $0.240, $0.250
Support levels: $0.180, $0.170, $0.160
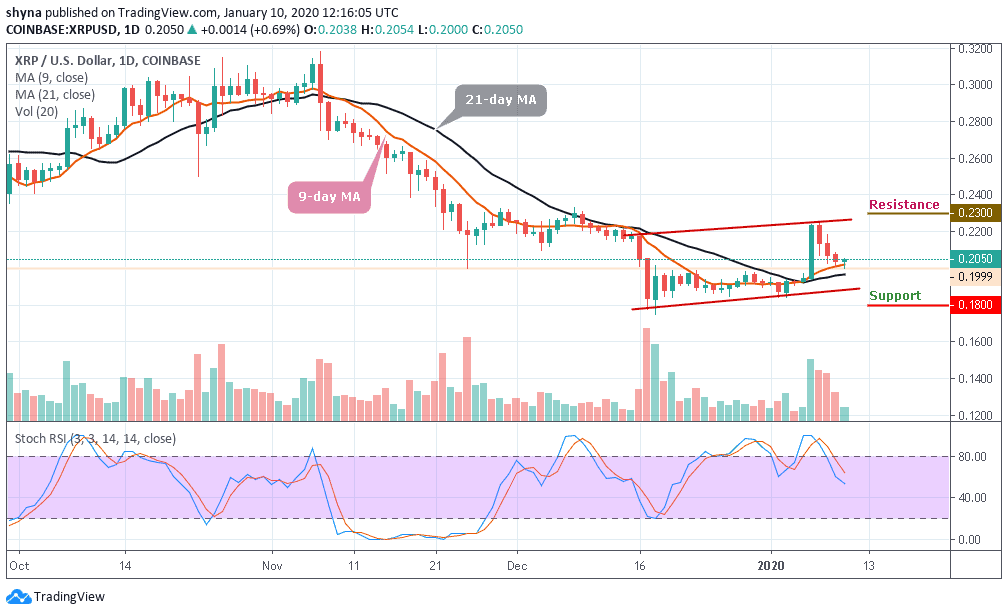
The spike in XRP/USD price at the beginning of the year led to the anticipation of a possible uptrend in the coming days but market bloodshed led by Bitcoin’s breach below $8,000, has seen most of the top altcoins lose ground against the dollar. The Ripple (XRP) is currently above the 9-day and 21-day moving averages and changing hands at $0.205 against the dollar trying to regain back from the losses of 3 days ago.
However, the coin has reversed nearly all gains of the week. As the stochastic RSI moves below the 70-level, any sustainable move below $0.200 will negate the short-term bullish setup and bring new sellers to the market. The next support may come at $0.190, which will be the lowest level of the week. It is followed by psychological $0.180, $0.170 and $0.160, the lowest level of 2020.
On the upside, we will need to see a sustainable move above $0.210 for the recovery to gain traction. This resistance is strengthened by the 9-day moving average at $0.203 while the next resistance may come at $0.214 and once it is out of the way, the upside is likely to gain traction with the next focus on $0.230, $0.240 and $0.250 which is the highest level of 2020.
Comparing with Bitcoin, for the past couple of days that the Ripple (XRP) fell drastically below the moving averages, the bulls have been trying to push the coin back to the upward movement. If they are able to push the price above the 9-day and 21-day moving averages, we can expect the price-rise to 2800 SAT and 2900 SAT resistance levels.

In other words, if the sellers continue to push the price down and break below the trend line of the channel, this might confirm the downward trend and the nearest support level is located at 2500 SAT. More so, further support is found at 2400 SAT and 2300 SAT respectively. The stochastic RSI is moving around the 40-level, which may lead the market into a sideways movement.
Please note: Insidebitcoins.com is not a financial advisor. Do your research before investing your funds in any financial asset or presented product or event. We are not responsible for your investing results.
Join Our Telegram channel to stay up to date on breaking news coverage