Join Our Telegram channel to stay up to date on breaking news coverage
XRP Price Prediction – February 3
Looking at the daily chart, XRP/USD tried to break out of a rising ascending channel as the price failed to gather enough momentum.
XRP/USD Market
Key Levels:
Resistance levels: $0.270, $0.280, $0.290
Support levels: $0.210, $0.200, $0.190
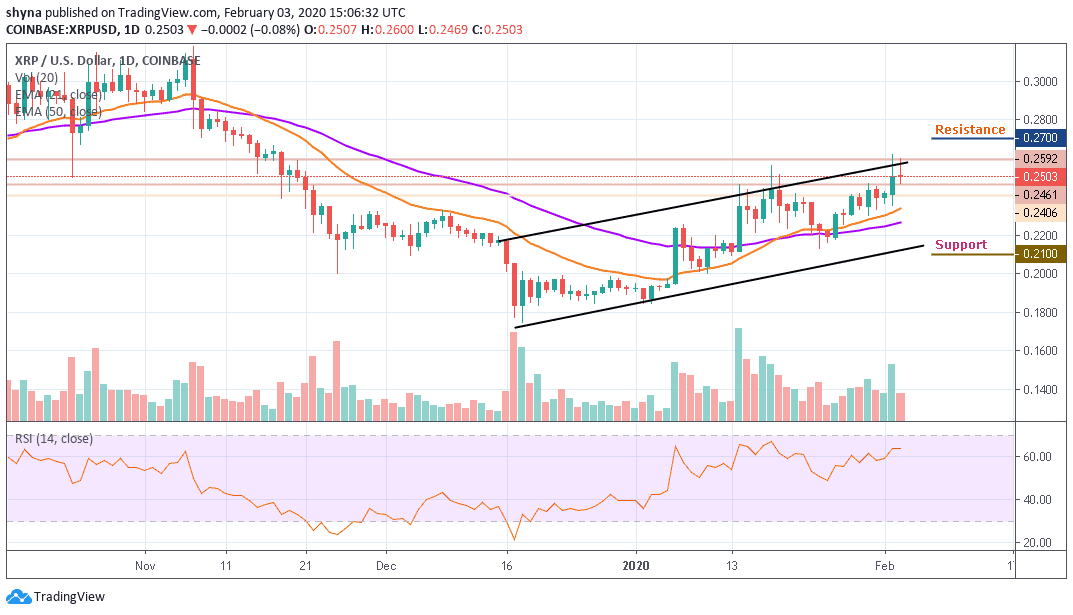
Today, XRP/USD broke free from the recent uptrend, the price absorbed stops located below $0.260 and slipped to $0.246 in a matter of minutes. While the price has partially recovered the losses to trade at $0.250 with 0.08% lower from the beginning of the day. Meanwhile, XRP/USD needs to regain ground above $0.259 to mitigate the bearish pressure.
In addition, XRP/USD is currently changing hands at $0.250 and any attempt to make it cross below the 21 and 50 periods EMA may open the doors for more downsides and the price could spike below the $0.225 support level. However, traders should keep an eye on the $0.220 and $0.215 before creating a new bullish trend at the resistance levels of $0.210, $0.200 and $0.190.
In other words, for the upside, the buyers will need to make a sustainable move above $0.260 as soon as possible to negate an immediate bearish scenario and improve the technical picture. Nevertheless, for the upside to gain traction, the coin needs to regain ground above $0.265, while $0.270, $0.280 and $0.290 resistance levels are the ultimate aims for the bulls. More so, the technical indicator RSI (14) suggests that the market may likely move in sideways for some time.
Against Bitcoin, the Ripple (XRP) is moving on the downside within the descending channel. If the selling pressure persists, the XRP price variation may likely bring a new low. At the moment, the stochastic RSI has moved above 50-level; a negative move may come to play in the market as the pair moves under the 21 periods EMA.
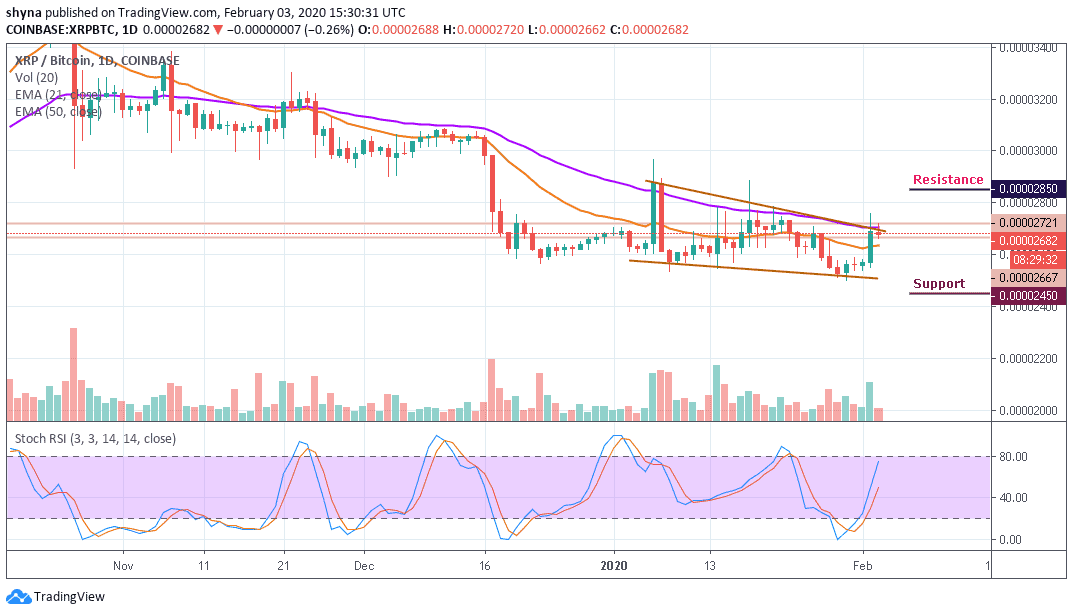
However, traders may expect close support below the 50 periods EMA at 2600 SAT before breaking to 2500 SAT and critically 2450 SAT levels. If a bullish movement occurs and validates a break above the upper boundary of the channel; we can then confirm a bull-run for the market and the nearest resistance levels lie at 2850 SAT and above.
Please note: Insidebitcoins.com is not a financial advisor. Do your research before investing your funds in any financial asset or presented product or event. We are not responsible for your investing results.
Read more:
- Bitcoin Price Prediction: BTC/USD Takes a Breather as Market Consolidates Above $8,500
- Litecoin Price Prediction: LTC/USD Builds Strength Above $60 Support, Targets the $80 High
Join Our Telegram channel to stay up to date on breaking news coverage