Join Our Telegram channel to stay up to date on breaking news coverage
XRP Price Prediction – November 6
XRP/USD followed a decent rise over the past few days as the coin now appears to be resuming a bullish run.
XRP/USD Market
Key Levels:
Resistance levels: $0.32, $0.33, $0.34
Support levels: $0.28, $0.27, $0.26
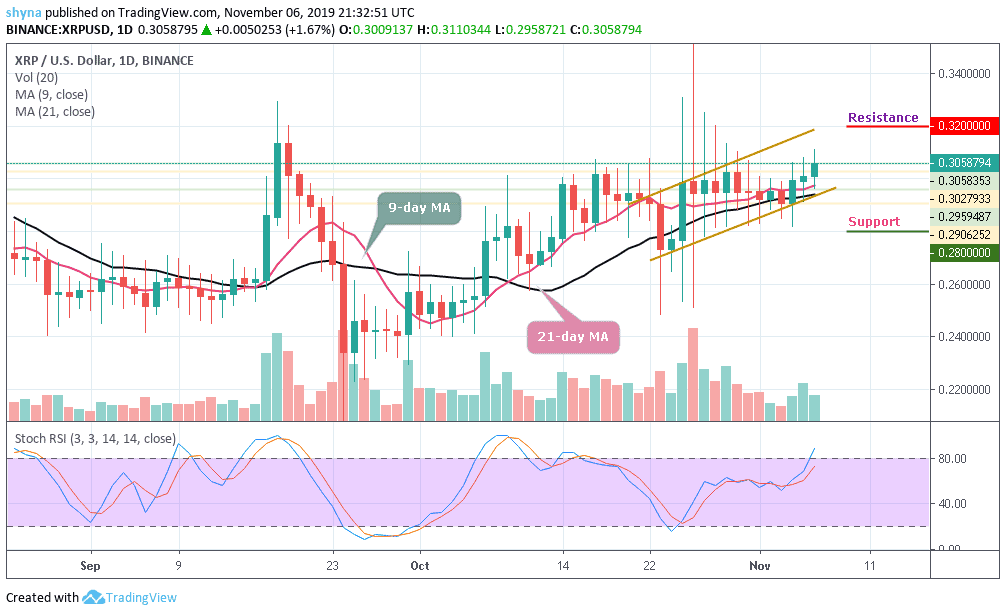
The Ripple price has seen a small increase of around 0.77% as the market opens today and it currently trades at $0.302 above the 9-day and 21-day MA. The cryptocurrency still has hard times moving above the $0.30 level as the previous attempts so far have failed. Despite this, XRP/USD has seen a 12.50% price hike over the past month and it remains the third-largest cryptocurrency with a market cap of $13.1 billion.
Moreover, in the last couple of days, the Ripple price has remained relatively strong to the extent that the gains above the vital $0.30 have been acutely steady. At the same time, the movement to a downward trend has been cut short. In the early hours of today, the Ripple price has gone down from $0.300 to $0.295. The bulls had taken the price up to $0.305 before the bears stepped back and took it down.
Furthermore, a significant cross above the key resistance could sustain the bulls to $0.310 high. Meanwhile, Ripple is currently on an upward trend and still maintaining it. If XRP manages to surge above $0.310, it may see the resistance levels at $0.32, $0.33 and $0.34, though a further drop may take the price to the support levels $0.28, $0.27 and $0.26. The Stochastic RSI indicator is showing some bullish signals by facing the overbought zone.
Against Bitcoin, before this time, the market price was moving in sideways and trading within the ascending channel. For now, XRP/BTC is trading at 3301 SAT and expecting a break out of the channel. Now, mere looking at the daily chart, both the bulls and the bears are struggling on who will dominate the market.
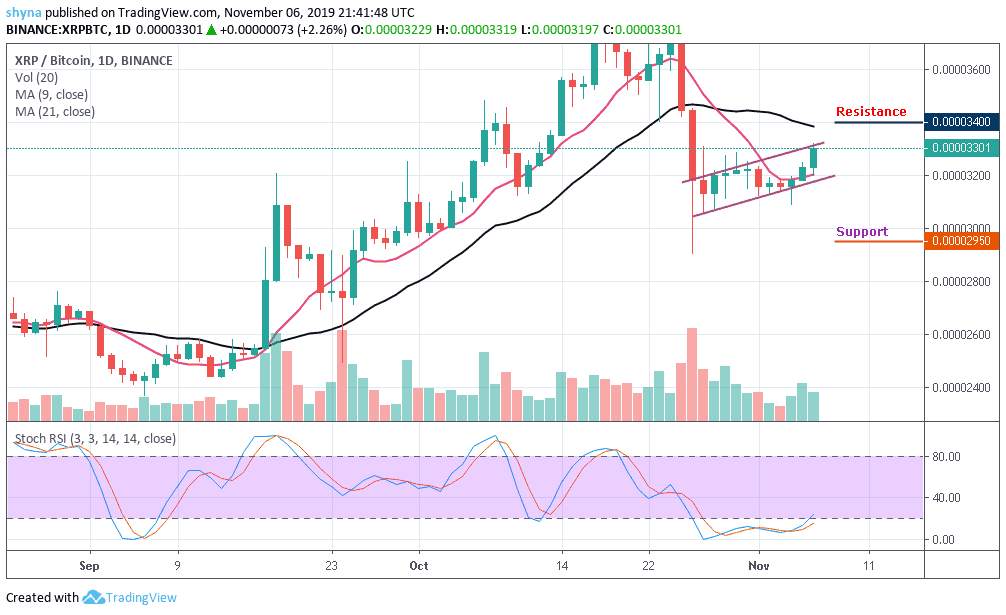
However, if the market drops, the next key supports will likely be at 2950 SAT and below. On the bullish side, a possible rise could push the market to the resistance levels of 3400 SAT and 3500 SAT. According to the stochastic RSI, the market is moving in sideways within the oversold territory, which could trigger more bullish signals in the market soon.
Please note: Insidebitcoins.com is not a financial advisor. Do your research before investing your funds in any financial asset or presented product or event. We are not responsible for your investing results.
Join Our Telegram channel to stay up to date on breaking news coverage