Join Our Telegram channel to stay up to date on breaking news coverage
XRP Price Prediction – December 18
Ripple (XRP) is trying to maintain the upward movement as the coin struggles to stay above $0.180 support but the focus remains on $0.200.
XRP/USD Market
Key Levels:
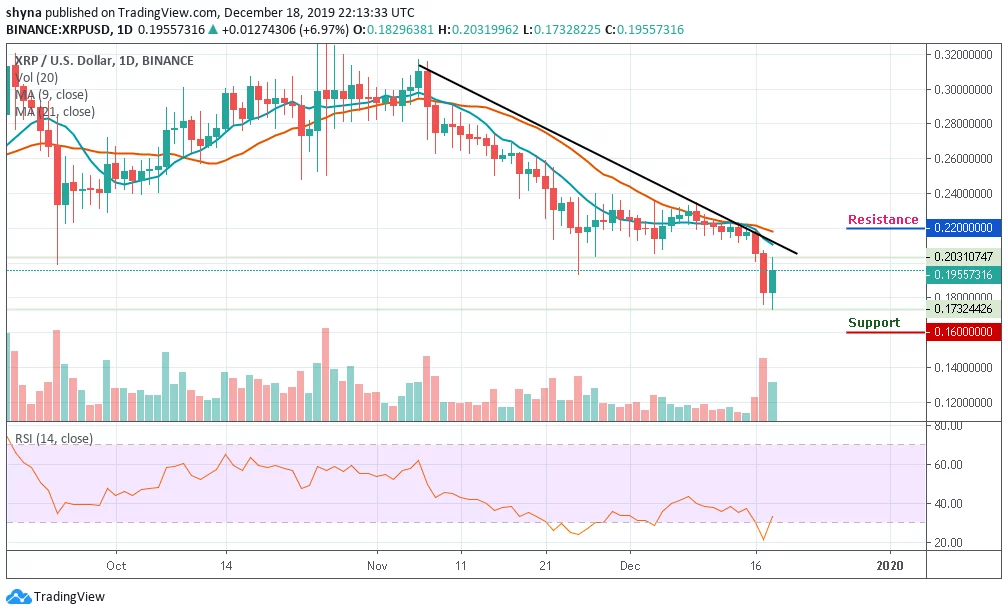
Resistance levels: $0.220, $0.230, $0.240
Support levels: $0.160, $0.150, $0.140
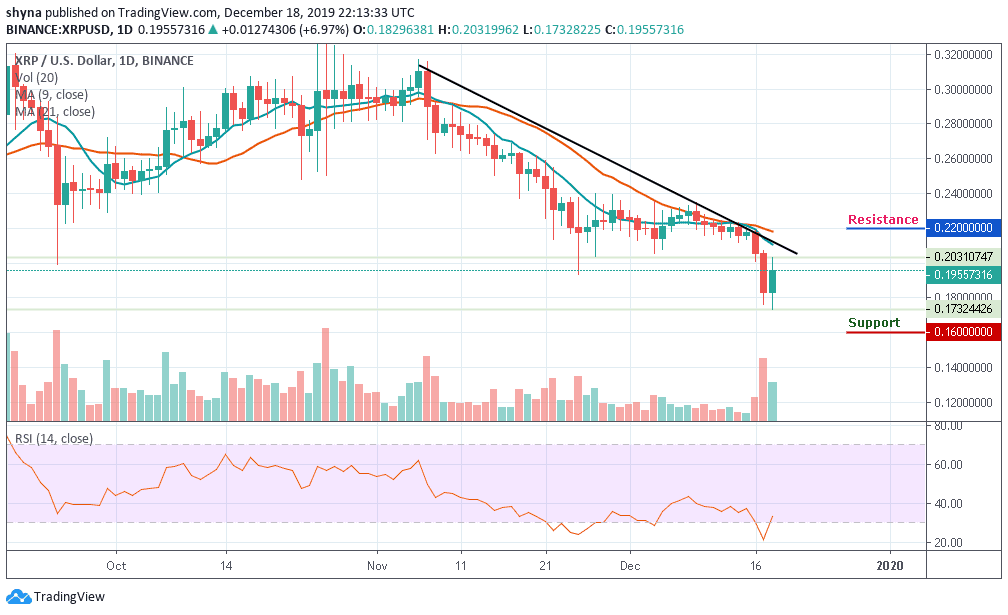
During early Asian hours today, XRP/USD has bottomed $0.173 and now recovering to $0.195 at the time of writing. Compared to yesterday’s trading, Ripple (XRP) has gained over 6.97% as the market opens today. Although the current movement is still below the 9-day and 21-day moving averages, If the bulls can manage to engineer a sustainable recovery above this handle, the short-term movement will improve slightly, while the coin will get a chance for an upside move towards $0.210.
In other words, XRP/USD may likely experience more losses should it continue to stay below $0.180. Ripple has recently crossed below the $0.175 level which has contributed to the downward movement. It has been so long since Ripple Price maintained a bullish sentiment and stood at least above $0.215. Over the past few days, the price of the XRP has collapsed to trade regularly below $0.220 level.
However, the RSI (14) on-going upward trend suggests that Ripple’s price action could continue in the direction of $0.200. Further upward movement may come face to face with the resistance at the 9-day and 21-day moving averages on the daily chart. As long as XRP stays above the support at $0.180 and focuses on breaking $0.200 resistance, the bulls have a higher chance of seeing gains towards $0.220, $0.230 and $0.240 resistance levels but a further drop may slip the price to $0.160, $0.150 and $0.140 support levels.
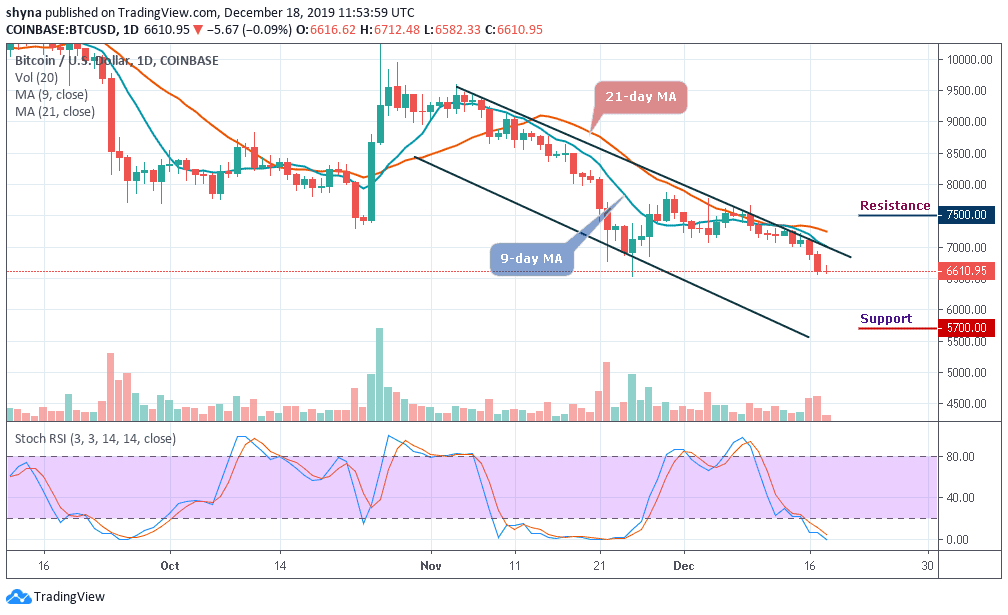
Against Bitcoin, XRP is trading on the downside and the price action has remained intact within the descending channel. If the selling pressure persists, the XRP price variation may likely create a new low in the coming days. For now, the RSI (14) has moved into the oversold zone; we may see more bearish signals in the market soon.

However, the coin trades below the 9-day and 21-day moving averages at 2721 SAT. Traders can expect close support at the 2500 SAT before breaking to 2400 SAT and potentially 2300 SAT levels. But, if a bullish movement occurs and validates a break significantly above the moving averages; we can then confirm a bull-run for the market and the closest resistance levels of 3000 SAT and above may be visited.
Please note: Insidebitcoins.com is not a financial advisor. Do your research before investing your funds in any financial asset or presented product or event. We are not responsible for your investing results.
Join Our Telegram channel to stay up to date on breaking news coverage