Join Our Telegram channel to stay up to date on breaking news coverage
Ripple price broke out of a symmetrical triangle on Tuesday, rising almost 5.5% to brush shoulders with $0.54. However, supplier congestion in this zone resulted in profit booking causing the remittance token’s price to turn down. At the time of writing, the Ripple was hovering around $0.5259, up 1.7% on the day and a 24-hour trading volume of $1.29 billion, according to data from CoinMarketCap.
Ripple price has been displaying significant volatility since the beginning of April, rising from the rigorous push and pull between the bulls and the bears. Due to this, the price has been coiling up within a symmetrical triangle unable to make any directional bias. However, yesterday’s breakout point brought a potential breakout toward $0.58 into the picture.
It should also be remembered that the XRP price always responds to any developments around the SEC v. Ripple case. In the latest development, Congressman Warren Davidson has brought a bill before the Congress proposing the dismissal of the chair of the United States Securities and Exchange Commission (SEC), Gary Gensler.
SEC Restructure Will “Correct A Long List Of Abuses”- Congressman Davidson
The San Francisco-based blockchain company has been fighting the SEC since December 2020 and with the long-running lawsuit possibly coming to an end, XRP enthusiasts are hopeful that the scales will tip in favor of Ripple.
The crypto community and particularly the XRP Army has always held the opinion that Gensler is unfit to lead the commission because of unfairly targeting crypto companies and his opinion that all cryptocurrencies are securities, except Bitcoin.
These sentiments are also shared by Congressman Warren Davidson who has introduced legislation in Congress proposing the dismissal of Gary Gensler from the SEC.
Sharing his intentions on Twitter on Tuesday, Congressman Davidson says he was calling for the SEC to be restructured as a way to “correct a long series of abuses” committed by the regulator and his chair.
Statement: “To correct a long series of abuses, I am introducing legislation that removes the Chairman of the Securities and Exchange Commission and replaces the role with an Executive Director that reports to the Board, where all authority resides. Former Chairs of the SEC will…
— Warren Davidson 🇺🇸 (@WarrenDavidson) April 18, 2023
Given the recent developments, it seems like the perfect time for Judge Torres to rule on the Ripple vs. SEC lawsuit, and if Ripple comes out victorious, it would be proof that Gensler’s exit may be necessary.
If that happens, it could lead to not only an increase in the value of XRP but also a bullish trend across the wider crypto market.
Ripple Price Could Exploit A Symmetrical Triangle To $0.58
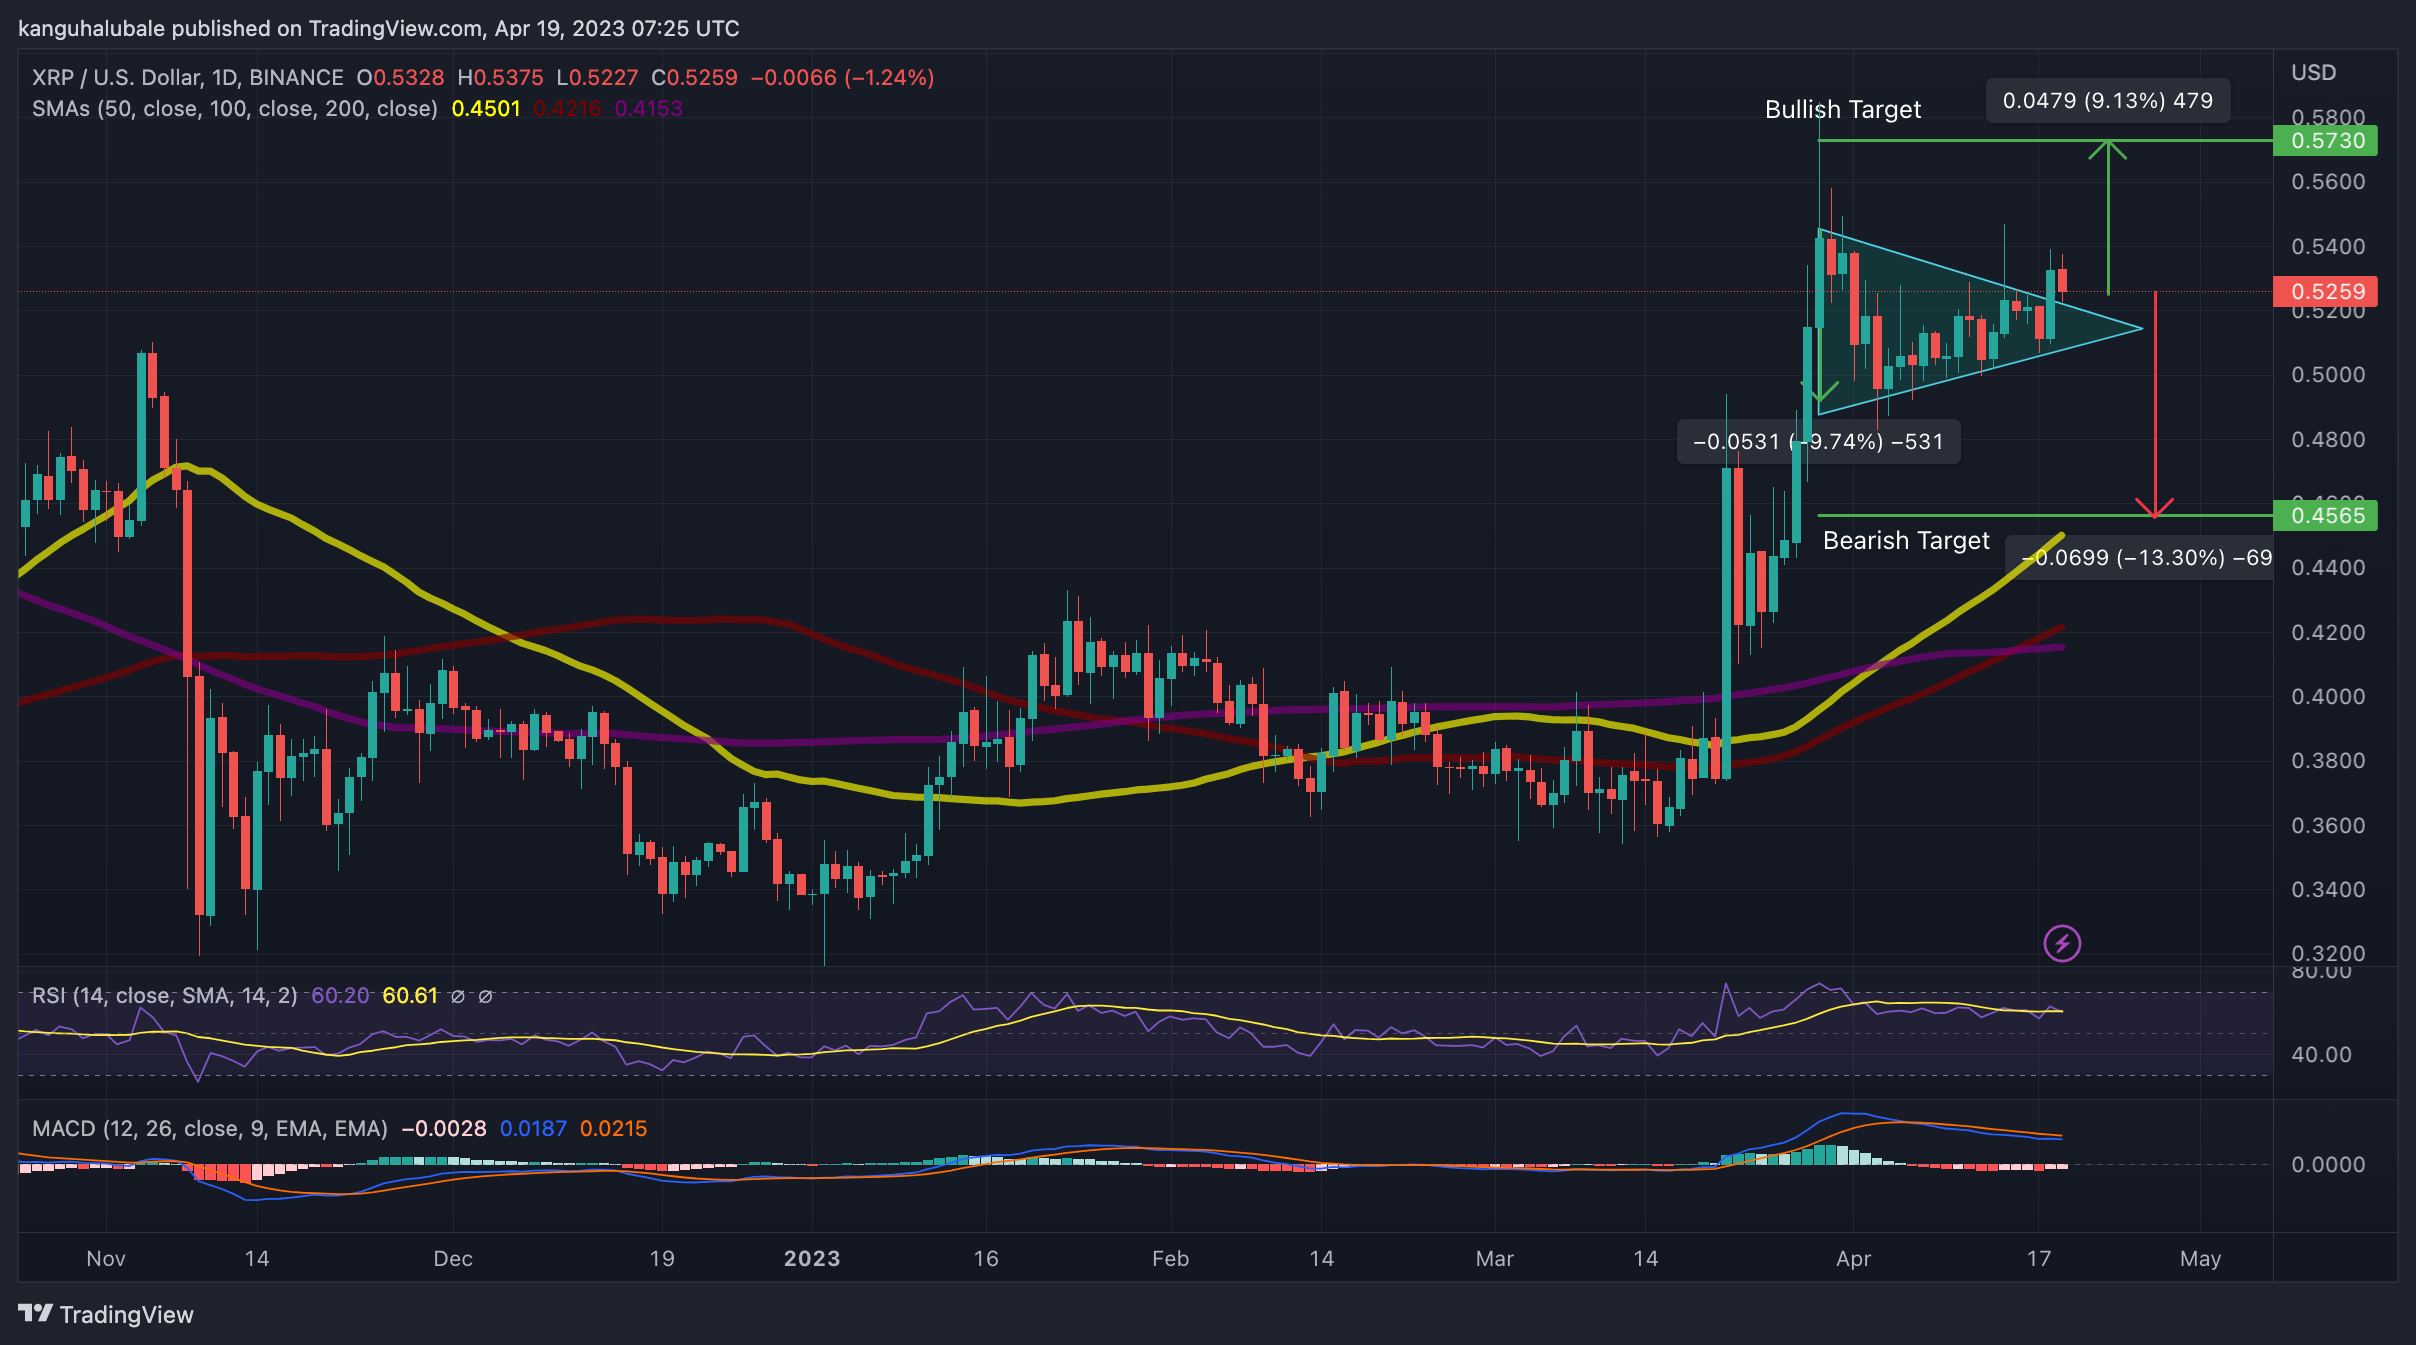
XRP price action between March 29 and April 17 created a symmetrical triangle on the daily chart (see below). This meant that the price was decreasing in volatility as it formed higher lows and lower highs. The chart pattern projected a 9.7% break out in either direction.
On April 17, the price broke out of the governing chart pattern when it produced a daily candlestick close above the triangle’s resistance line at $0.5231. This confirmed a bullish breakout from the triangle with the next barrier lying at the $0.54 level.
Above that, the cross-border payments crypto could climb above the $0.55 psychological level to reach the bullish target of the prevailing chart pattern at $0.5730. Higher than that, the next logical move would be a return to the $0.58 psychological level, representing a 10% uptick from the current price.
XRP/USD Daily Chart

Supporting Ripple’s bullish case were the upward-facing Simple Moving Averages (SMAs). Additionally, the 100-day SMA had just produced a bullish cross when it moved above the 200-day SMA on April 15. A bullish cross is a technical formation that occurs when a faster-moving average (in this case, the 100-day SMA) rises above a slower-moving average (in this case, the 200-day SMA). Such a crossover is often interpreted as a bullish scenario, indicating a buy signal with the expectation that the upward trend will continue.
The Relative Strength Index (RSI) presented the same scenario with its position in the positive region. The price strength at 60 indicated that the path with the least resistance was northward.
Furthermore, the Moving Average Convergence Divergence (MACD) indicator was moving above the zero line within the positive region. This suggested that the market conditions favored the upside.
On the flip side, the downfacing MACD implies that the buying momentum is fading out, pointing to a possible extension of the ongoing correction. Therefore, Ripple price could move back into the confines of the symmetrical triangle where it could continue consolidating for a few days.
However, a drop below the triangle’s support line would trigger passive sell orders that could see XRP drop first toward the $0.50 psychological level and later to the $0.47 support level before reaching the bearish target of the triangle at $0.4565. This would bring the total losses to 13.13% from the current levels.
Related News:
- Bitcoin Price Prediction for Today, April 19: BTC Price Halts below $30.4K
- How to Buy Cryptocurrencies
Join Our Telegram channel to stay up to date on breaking news coverage


