Join Our Telegram channel to stay up to date on breaking news coverage
Price action in the XRP/USD market has been generally on an uptrend, and this started around Mid last month. Although, currently there appears to be a significant pullback in price movement, there are still possibilities that the uptrend may continue.
XRP Analysis Statistics Data:
Ripple’s value now: $0.500
XRP’s market cap: $24.62 billion
Ripple’s moving supply: 49.96 billion
Total supply of XRP: 99.99 billion
Ripple’s Coinmarketcap ranking: #6
Consequently, this calls for more careful examination, to better understand and profitable utilize this market signs. We shall also examine the XRP/BTC market too with like motive as that of the XRP/USD.
Key Price Levels:
Top Levels: $0.500, $0.540, $0.580
Bottom Levels: $0.480, $0.450, $0.420
Ripple Price Prediction Today October 12, 2022: XRP/USD Uptrend May Continue
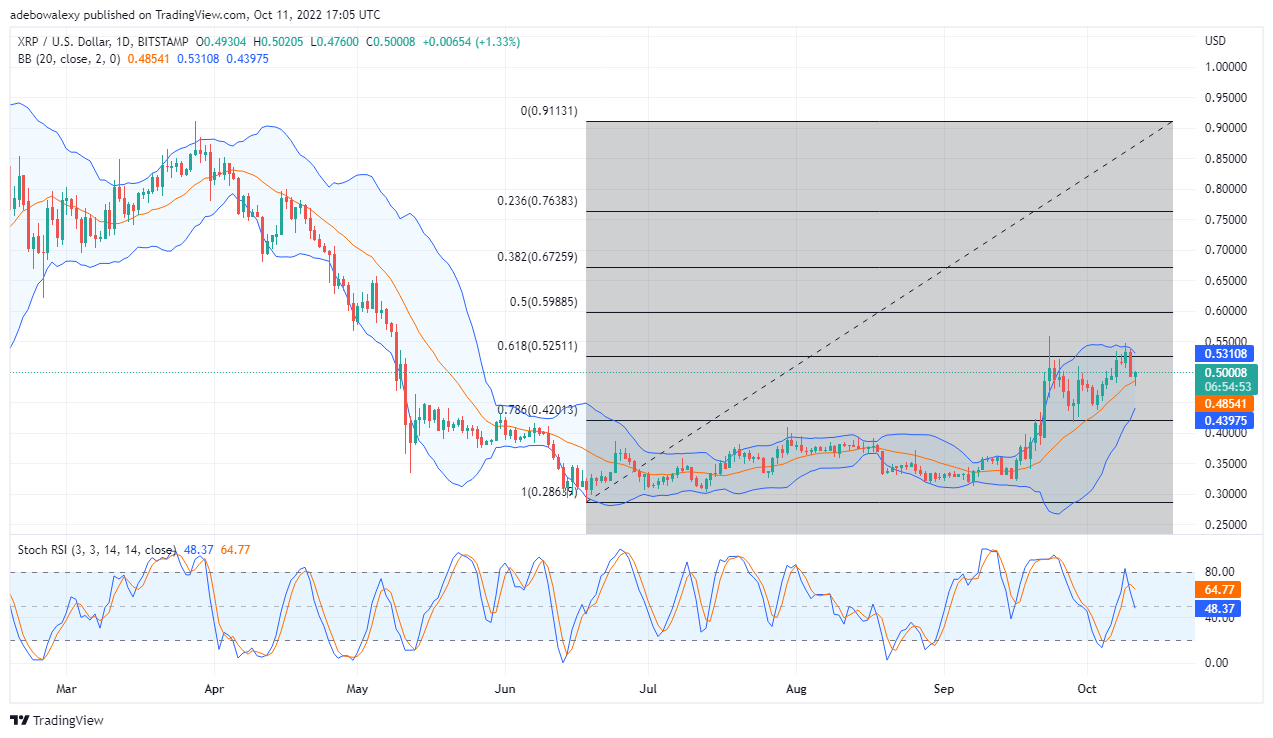
The XRP/USD 24-hours price chart features that price action is on a general uptrend. Moving on, the last price candle on this chart formed above the MA of the applied Bollinger indicator, following the appearance of a long bearish candle. This bearish candle caused a considerable pullback to price action. However, the fact that a bullish candle still forms above the MA implies that the uptrend may continue. Furthermore, the Stochastic RSI curves has performed a bearish crossover above the 50% level. Nevertheless, the leading line has reached the 48%, it is possible for price to continue its upside trajectory, if the bulls are able to retain the lead. Eventually this will initiate a correction in the bearing of the RSI, and subsequently perform a bullish crossover. Therefore, traders can still expect price movement to break the Fib level 61.80 of price $0.525.
Ripple Price Prediction Today October 12, 2022: XRP/BTC Obtains Support Above 0.00002500
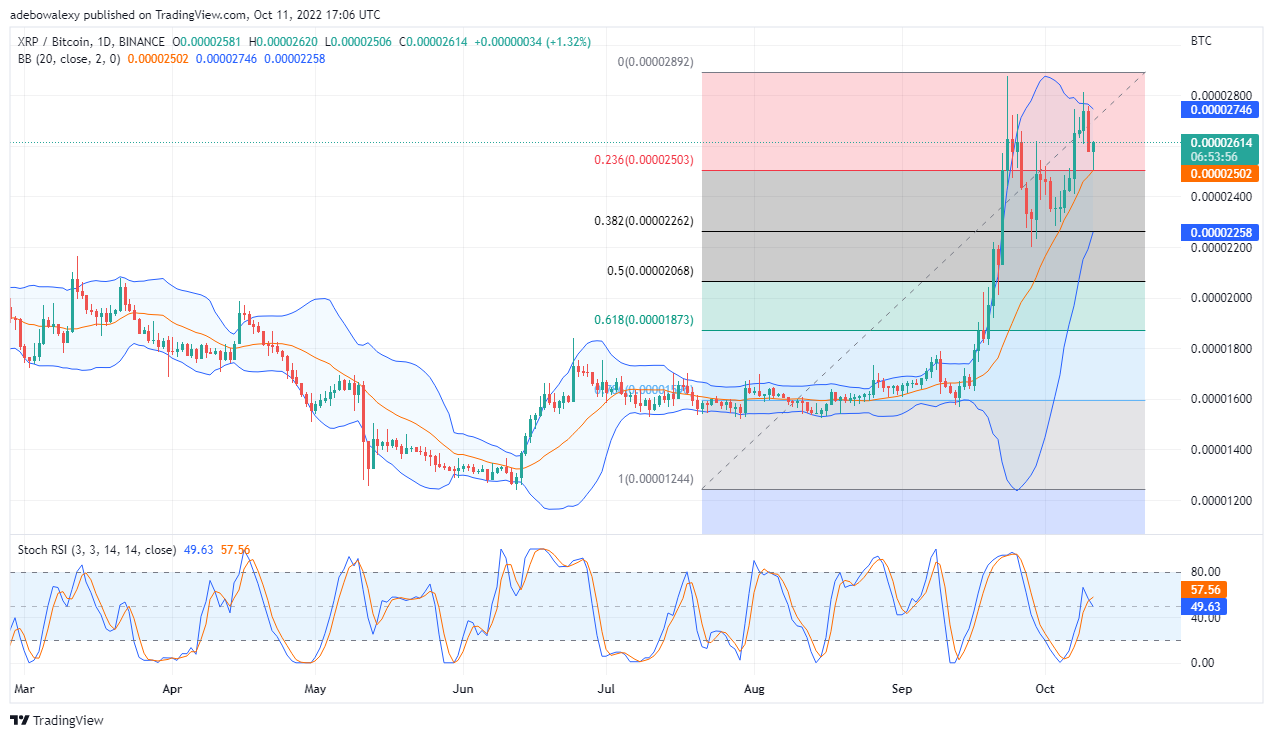
XRP/BTC price action has broken the price level 0.00002500 to the upside, and also may have found support above this level. The last candle seems to have bounced off the 0.00002500 following a downward correction via a long bearish candle. Moving on, the formation of a bullish candle just formed above the MA line of the Bollinger indicator, indicates that the general uptrend will likely continue.
Your capital is at risk.
Meanwhile, the Stochastic RSI has delivered a bearish crossover at the 50% mark. However, following the crossover, the lines of this Indicator are not taking a downward direction yet, but seems to be sideways. We can attribute this to the fact that the bulls seems to have once again snatched price control from the bears, given the last candle on this chart. Going by all these signs traders here can expect price action to continue in its upward path at least till the Fib level 0 is tested. Therefore traders can either buy straight or place a pending long position at 0.00002650.
Join Our Telegram channel to stay up to date on breaking news coverage
