Join Our Telegram channel to stay up to date on breaking news coverage
XRP Price Prediction – December 20
Ripple (XRP) consolidates in a flag formation as the bulls move towards the 9-day moving average within the descending channel.
XRP/USD Market
Key Levels:
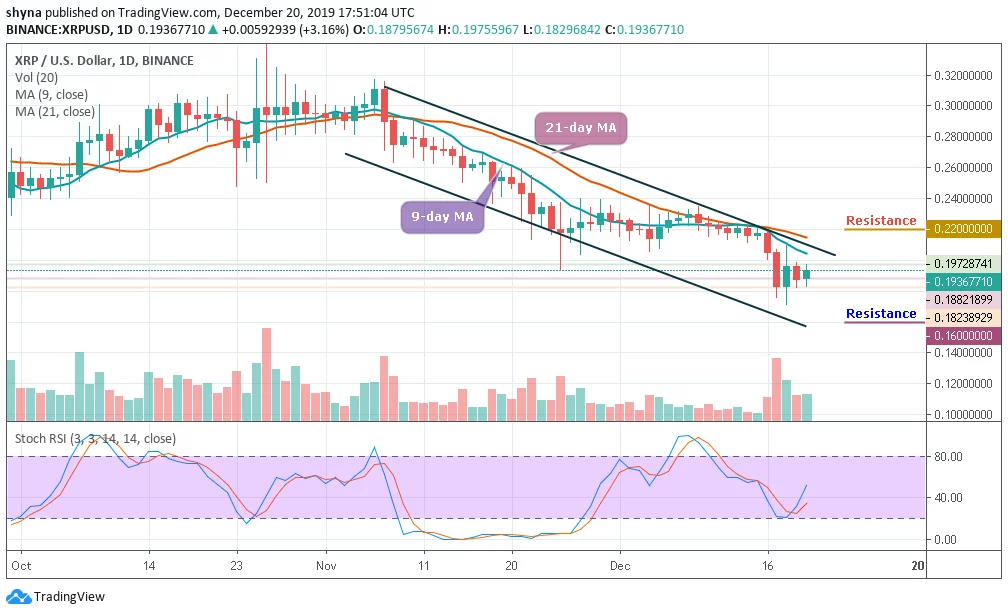
Resistance levels: $0.220, $0.230, $0.240
Support levels: $0.160, $0.150, $0.140
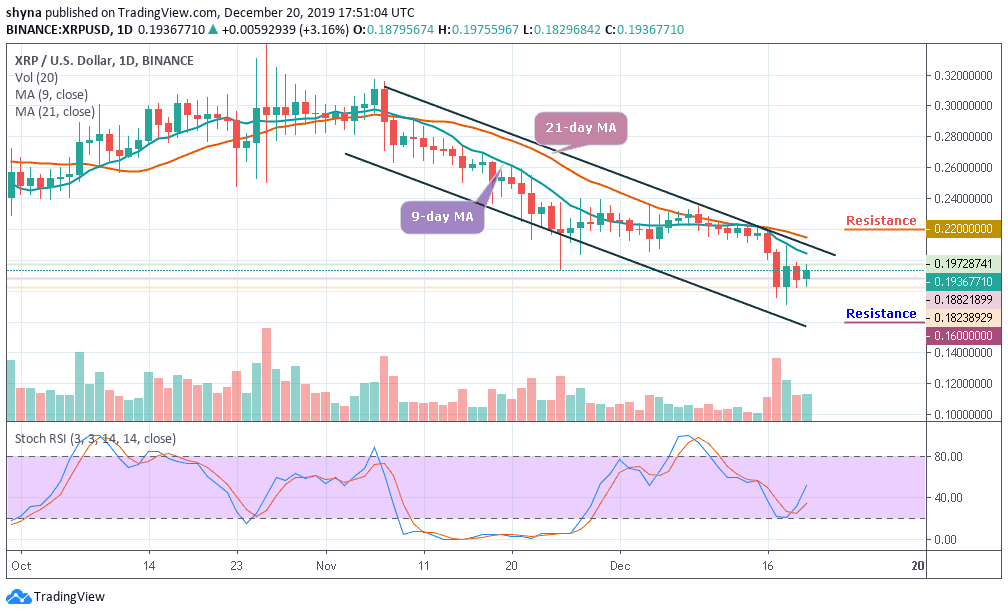
XRP/USD bulls have taken control of the daily price chart following yesterday’s bearish movement and the price is attempting to move above the moving averages of 9-day and 21-day. Looking at the chart, the coin is presently consolidating in a flag pattern and trading under the moving averages, while the trading volume rises slowly.
Moreover, the Ripple (XRP) has made a gain of 2.83% in the last 24 hours and the buyers have taken the price up from $0.188 to $0.193 where the price is currently negotiating with the resistance level. Meanwhile, any attempt made by the bulls to push the coin above the $0.193, then the resistance level of $0.200 may come to play.
However, if the price drops below the $0.180 support level, the pair may likely locate the $0.170 support, which is close support level for the bears. More so, a bearish continuation could bring the market to the critical supports at $0.160, $0.150 and $0.140 respectively. On the contrary, should the bulls continue with the upward trend, the price may likely break out of the channel to hit the potential resistance levels at $0.220, $0.230 and $0.240.
Meanwhile, the stochastic RSI faces upward, hoping to cross above 40-level which may likely boost the upward movement of the coin.
When compares with Bitcoin, the trend of the pair is still perpetually looking bearish in the long-term, priced at around 2701 SAT. Meanwhile, the 3rd largest cryptocurrency is witnessing the same trend against USD and the bearish continuation may likely take the price to the support levels at 2400 SAT and 2200 SAT if broken the lower boundary of the descending channel.
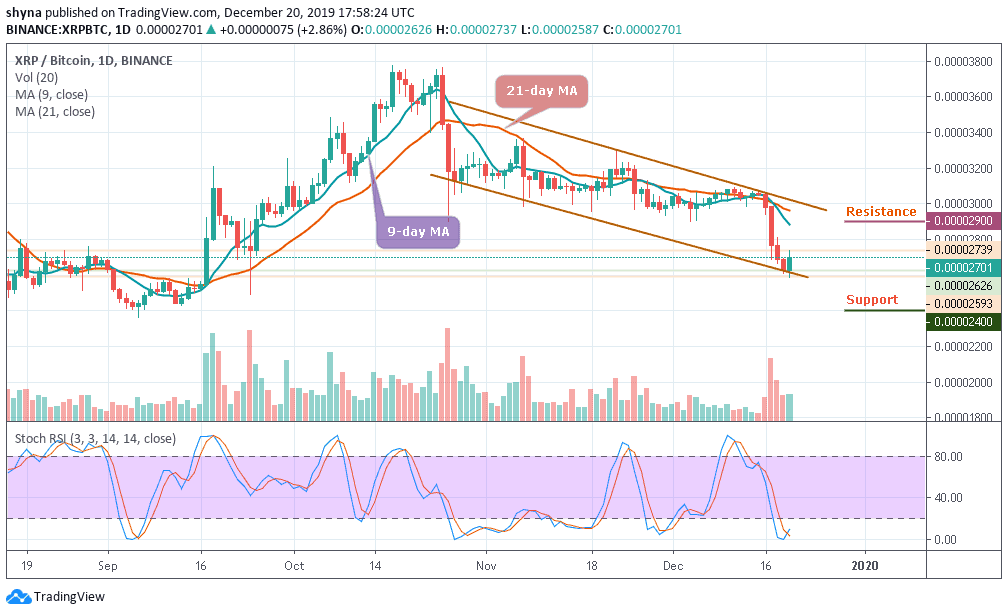
However, if the bulls maintain and hold the price very well, we can expect the coin to rise toward the moving averages. For now, the nearest resistance levels for the market are 2900 SAT and 3100 SAT. Looking at the chart, the XRP/BTC pair is slowly rising again with a bullish trading volume while the stochastic RSI moves within the oversold zone.
Please note: Insidebitcoins.com is not a financial advisor. Do your research before investing your funds in any financial asset or presented product or event. We are not responsible for your investing results.
Join Our Telegram channel to stay up to date on breaking news coverage