
Join Our Telegram channel to stay up to date on breaking news coverage
The Ripple price prediction shows XRP could renew the bullish trend after testing the support level of $0.35 today.
Ripple Prediction Statistics Data:
- Ripple price now – $0.36
- Ripple market cap – $17.5 billion
- Ripple circulating supply – 48.34 billion
- Ripple total supply – 99.98 billion
- Ripple Coinmarketcap ranking – #7
XRP/USD Market
Key Levels:
Resistance levels: $0.50, $0.55, $0.60
Support levels: $0.20, $0.15, $0.10
XRP/USD regains ground after touching the daily low at $0.25 during the European session today. The Ripple price is currently changing hands at $0.36 and despite the recovery, the coin is hovering above the 9-day and 21-day moving averages.
Ripple Price Prediction: Would Ripple Price Move to the Upside?
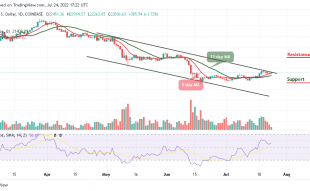
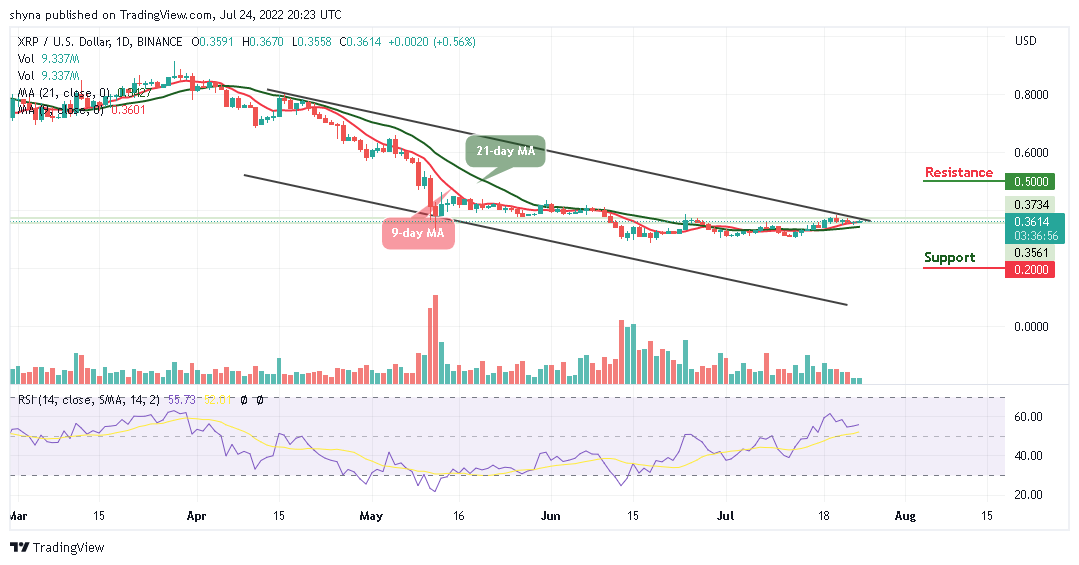
According to the daily chart, the Ripple price is moving towards the resistance level of $0.38 as the initial move to cross the upper boundary of the channel could boost the price further up. The Ripple (XRP) hits the daily high at $0.36 before retreating to where it is currently trading. Looking at it from above, more bullish movements may come into play if the Ripple price stays above the moving averages as the nearest resistance level could be found at $0.40.
However, traders can see that the daily movement remains in the hands of the bulls as the technical indicator Relative Strength Index (14) remains above 50-level, building on the consistent recovery from the downside. Meanwhile, a break above the $0.40 level may most likely push the coin towards the potential resistance levels of $0.50, $.55, and $0.60 while a drop towards the lower boundary of the channel may lead to the supports of $0.20, $0.15, and $0.10 respectively.
Against Bitcoin, the Ripple price is seen moving sideways around the 9-day and 21-day moving averages. After the coin touches the daily high at 1612 SAT today, the coin later retreated to the low of 1592 SAT. Meanwhile, the price keeps moving sideways as the buyers may step back into the market.
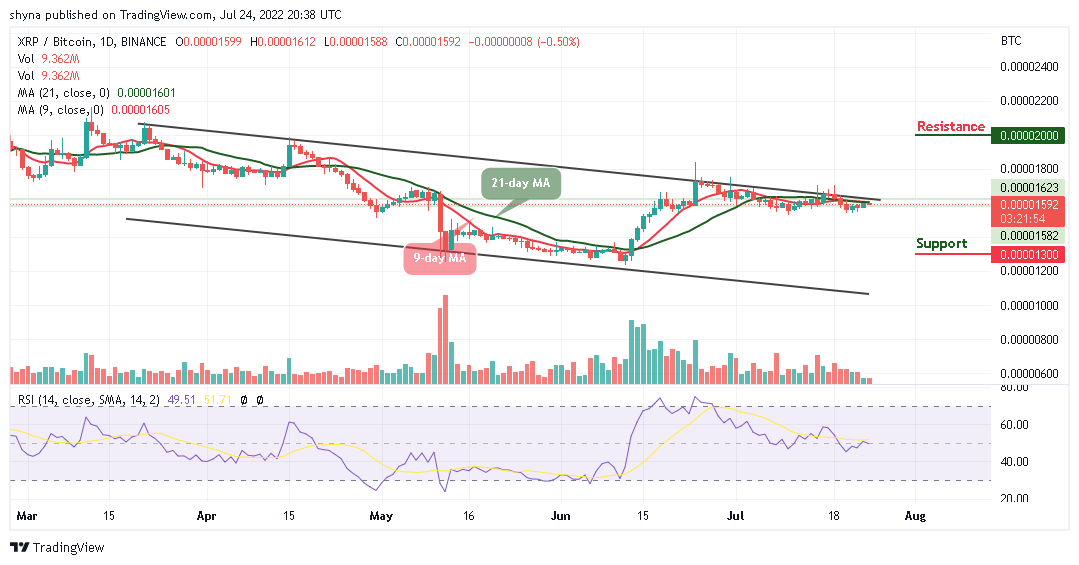
Moreover, should the sellers return to the market, the Ripple price may drop to the support of 1300 SAT and below. At the moment, the technical indicator Relative Strength Index (14) stays above 50-level as the market could face the upward movement in the next positive direction while the resistance level could be located at $2000 and above.
Join Our Telegram channel to stay up to date on breaking news coverage