Join Our Telegram channel to stay up to date on breaking news coverage
XRP Price Prediction – June 29
XRP/USD is seen trading below the moving averages against the US dollar.
XRP/USD Market
Key Levels:
Resistance levels: $0.190, $0.200, $0.210
Support levels: $0.160, $0.150, $0.140
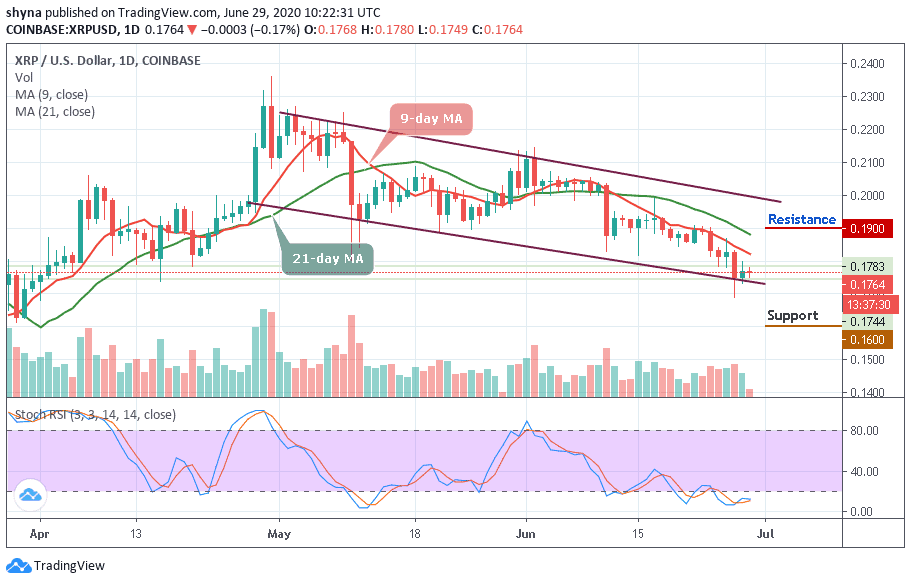
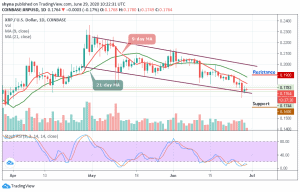
XRP/USD may be stagnant, trending in a tight trade range as it is slowly declining below the key supports. The coin might revisit the $0.170 support before it could start a new increase. After struggling to stay above $0.175, Ripple (XRP) started a slow and steady decline. The coin is trading below the key $0.180 support area to move into a short term bearish zone.
However, the pair is currently exchanging hands at $0.176 and any attempt to make it cross below the lower boundary of the channel may likely open the doors for more downsides and the price could spike below the $0.170 support level. However, traders should keep an eye on the $0.180 before creating a new bullish trend at the resistance levels of $0.190, $0.200, and $0.210.
More so, we may experience a quick buy once the trade reaches the support at $0.180. And if the price fails to rebound, then a bearish breakout is likely to trigger more selling opportunity for traders, which might cause the price to retest $0.160 and could further drop to $0.150 and $0.140 support levels respectively.
Meanwhile, the technical indicator stochastic RSI is moving within the oversold territory, Ripple (XRP) may continue to fall more or follow a sideways movement.
Comparing with BTC, the Ripple (XRP) is moving on the downside within the descending channel. If the selling pressure persists, the XRP price variation may likely bring a new low. At the moment, the technical indicator RSI (14) is moving into the oversold zone; more negative moves may come to play in the market as the pair moves under the 9-day and 21-day moving averages.
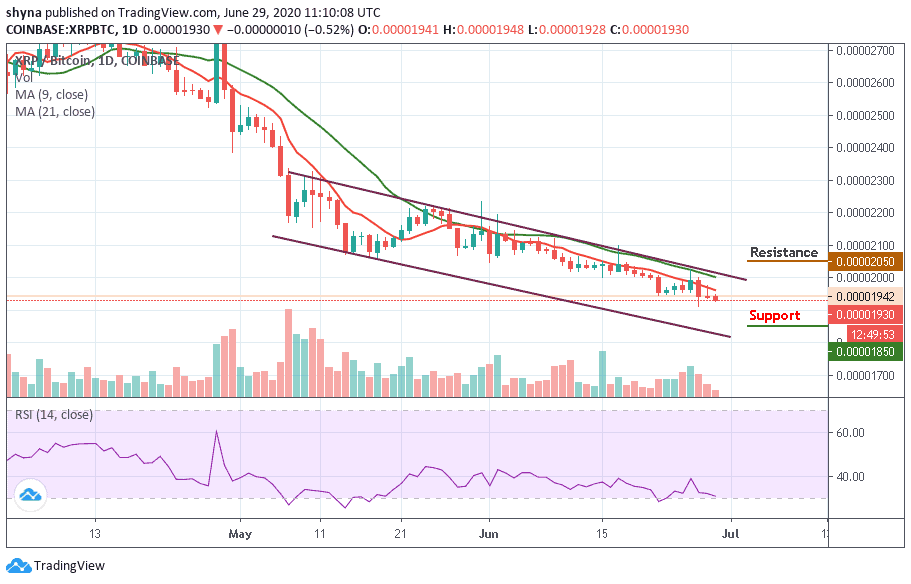
However, traders may expect close support below the moving averages at the 1900 SAT before breaking to 1850 SAT and critically 1800 SAT levels. If a bullish movement occurs and validates a break above the moving averages; we can then confirm a bull-run for the market and the nearest resistance levels lie at 2050 SAT and above.
Join Our Telegram channel to stay up to date on breaking news coverage