Join Our Telegram channel to stay up to date on breaking news coverage
XRP Price Analysis – November 1
Ripple price is facing an increase in selling pressure below the $0.295 resistance against the US dollar.
XRP/USD Market
Key Levels:
Resistance levels: $0.32, $0.33, $0.34
Support levels: $0.26, $0.25, $0.24

Ripple price is slowly declining below key supports against USD. XRP/USD price might revisit the $0.270 support before it could start a fresh increase. After struggling to stay above $0.302, Ripple started a slow and steady decline. The coin traded below the key $0.295 support area to move into a short term bearish zone.
Moreover, the pair is currently exchanging hands at $0.292 and any attempt to make it cross below the 9-day moving average may open the doors for more downsides and the price could spike below the $0.280 support level. However, we should keep an eye on the $0.270 and $0.275 before creating a new bullish trend at the resistance levels of $0.32, $0.33 and $0.34.
Furthermore, we may experience a quick buy once the trade reaches the support at $0.270. And if the price fails to rebound, then a bearish breakout is likely to trigger more selling opportunity for traders, which might cause the price to retest $0.26 and could further drop to $0.24 and $0.23 support levels respectively. The RSI (14) nosedive to level 54. If the price moves downward, XRP may fall more.
Against Bitcoin, the pair is consolidating within the channel and moving below the 9-day moving average. Meanwhile, the buyers are trying to push the price above the moving average and the bullish continuation may take it to the resistance levels of 3500 SAT and 3600 SAT respectively.
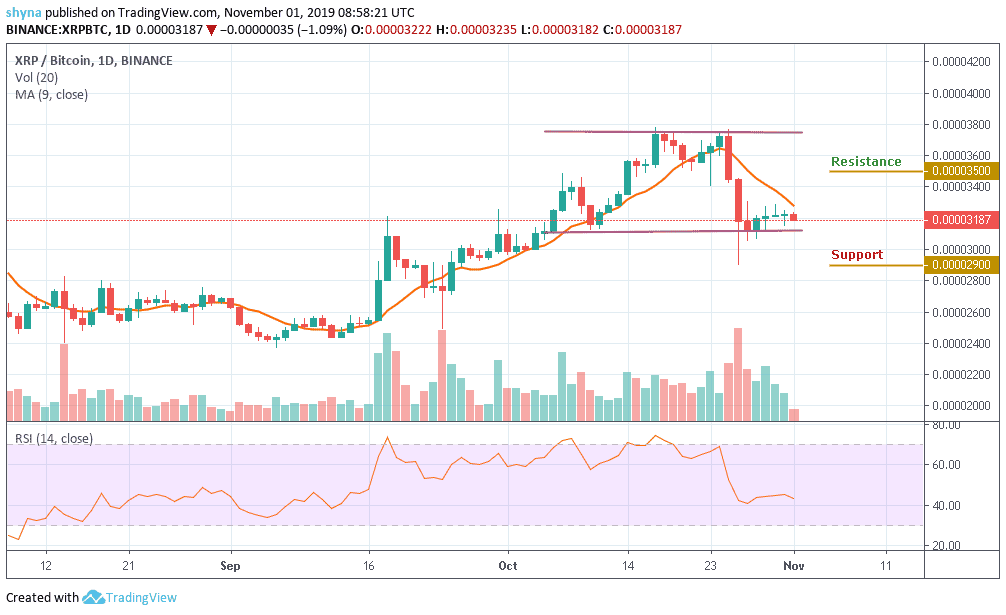
Moreover, looking at the chart, if the bulls failed to hold the price, then it may likely fall below the channel and the nearest support levels for the coin are 2900 SAT and 2800 SAT. The RSI (14) moves above level 40, which indicates some sideways movement.
Please note: Insidebitcoins.com is not a financial advisor. Do your research before investing your funds in any financial asset or presented product or event. We are not responsible for your investing results.
Join Our Telegram channel to stay up to date on breaking news coverage