Join Our Telegram channel to stay up to date on breaking news coverage
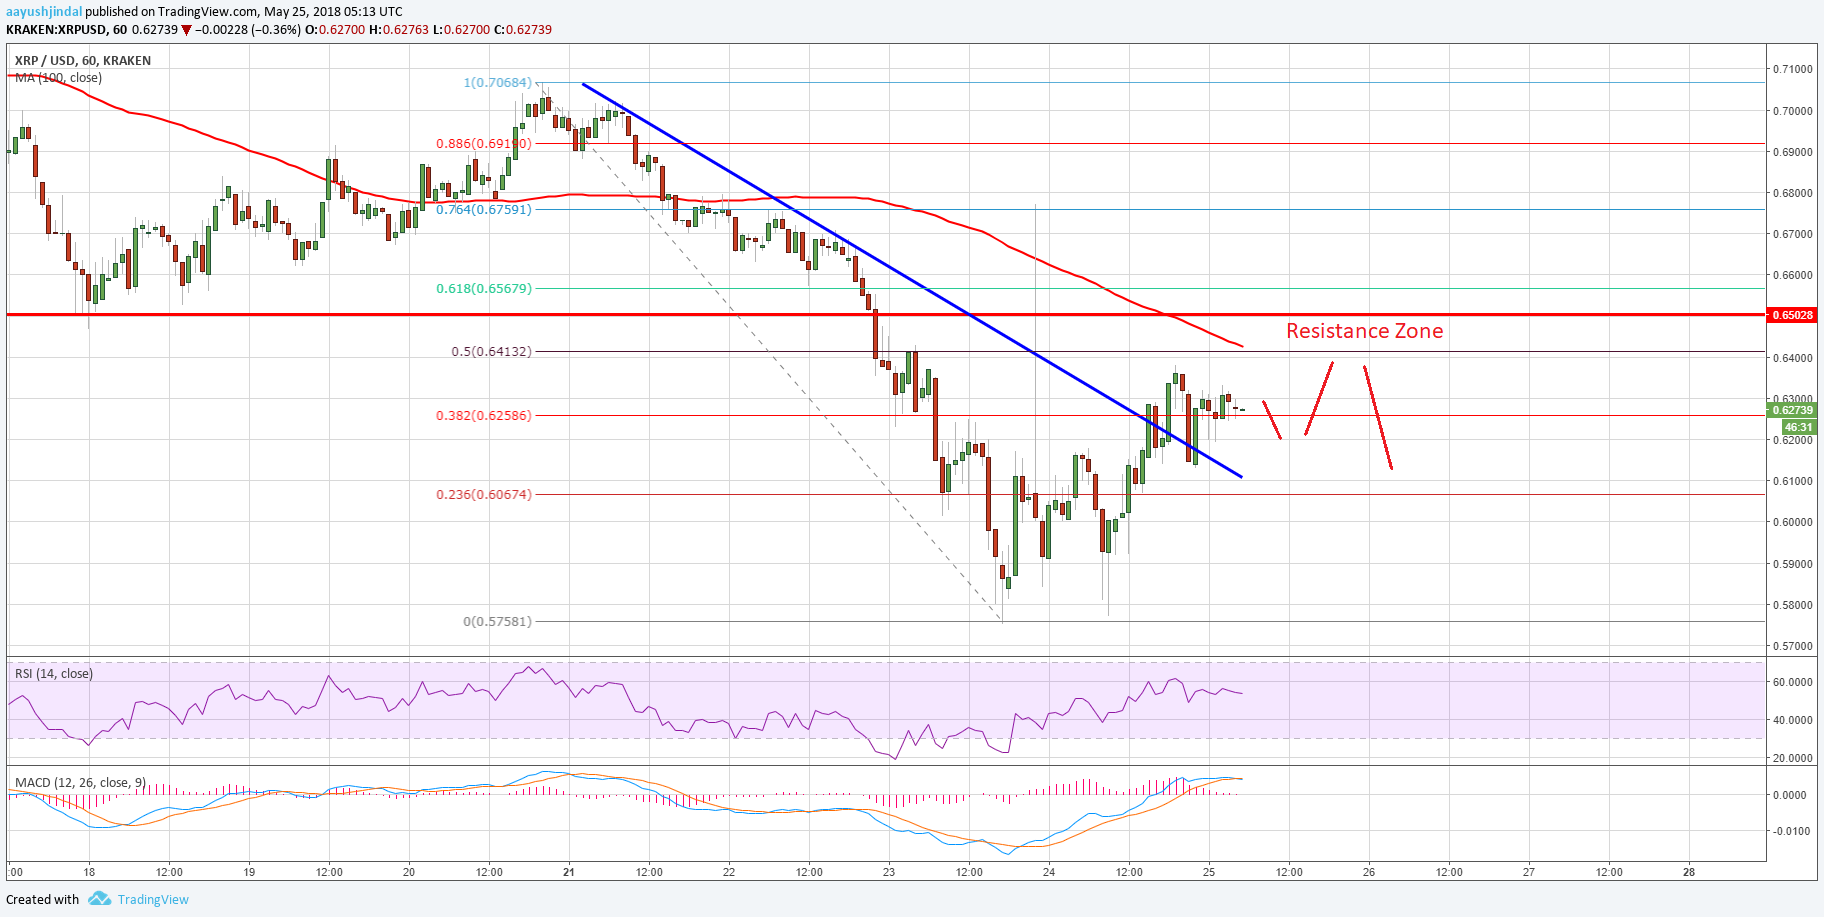
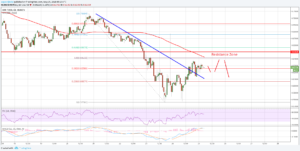
Key Highlights Ripple price traded as low as $0.5758 before starting a correction against the US dollar. This week’s followed crucial bearish trend line with resistance at $0.6200 was broken on the hourly chart of the XRP/USD pair (data source from Kraken). The pair may correct further higher, but it may face a strong selling interest near $0.6400-0.6500.
Ripple price is slowly recovering against the US Dollar and Bitcoin. XRP/USD may face a tough challenge near the $0.6500 resistance level, which was a support earlier.
Ripple Price Recovery
A decent low was formed near $0.5760 in Ripple price against the US Dollar. The price traded as low as $0.5758 and later is started an upward correction. It recovered nicely and moved above the $0.5900 and $0.6000 resistance levels. Moreover, there was a break above the 23.6% Fib retracement level of the last slide from the $0.7068 high to $0.5758 low.
More importantly, this week’s followed crucial bearish trend line with resistance at $0.6200 was broken on the hourly chart of the XRP/USD pair. On the upside, the next major hurdle for buyer is near $0.6400. It represents the 50% Fib retracement level of the last slide from the $0.7068 high to $0.5758 low. Further above $0.6400, the $0.6500 level is a crucial barrier. The stated $0.6500 level was a support earlier, and now it is likely to prevent further gains. Additionally, the 100 hourly simple moving average is positioned near $0.6410, which is another important resistance.
Looking at the chart, there are a few positive signs above the $0.6000 level. If buyers succeed in breaking the $0.6400 and $0.6500 resistance levels, ripple could accelerate higher. On the downside, the broken hurdles near $0.6000 and $0.5900 are likely to act as supports.
Looking at the technical indicators:
Hourly MACD – The MACD for XRP/USD is currently flat in the bullish zone.
Hourly RSI (Relative Strength Index) – The RSI for XRP/USD is now placed nicely above the 50 level.
Major Support Level – $0.6000
Major Resistance Level – $0.6400
The post Ripple Price Analysis: XRP/USD Showing Positive Signs appeared first on NewsBTC.
Join Our Telegram channel to stay up to date on breaking news coverage