Join Our Telegram channel to stay up to date on breaking news coverage
XRP Price Prediction – March 1
Ripple (XRP) is down with 0.7% in the last 24 hours as the value has gone below $0.23.
XRP/USD Market
Key Levels:
Resistance levels: $0.29, $0.30, $0.31
Support levels: $0.17, $0.16, $0.15
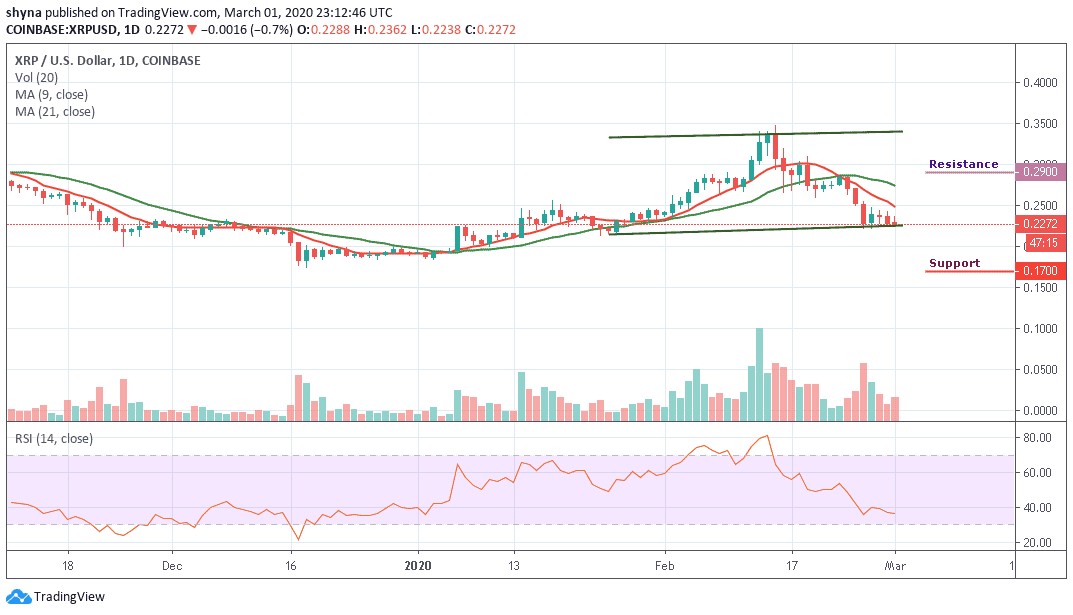
Earlier today, XRP/USD has gone up from $0.22 to $0.23 before giving a bearish signal at the time of writing, the coin is also floating below the 9-day and 21-day moving averages as the technical indicator RSI (14) moves around 37-level. Meanwhile, a break below the channel could give the market enough strength to dig dip, but moving towards the north might lead the market to a bullish scenario.
At the moment, the Ripple price has continued to demonstrate a sign of weakness across its markets. Looking at the daily chart, the XRP/USD market is down by 0.7%, reflecting a price drop in the market and the fall might become heavy if the bearish action continues. Meanwhile, the Ripple (XRP) has witnessed a bullish drive against USD for more than three weeks.
Therefore, since the XRP/USD is moving bullishly on short-term outlook, traders can expect the trend to keep advancing higher if the price actions still remain inside the channel. A breakout above the moving averages could strengthen bulls and push the price to the resistance levels of $29, $30 and $31 or a channel breakdown might lead the market in a bearish scenario if the price continues to fades and the closest supports to keep an eye on are $0.17, $0.16, and critically $0.15.
Against BTC, XRP moves at the downside, actually, the price action has remained intact within the channel. If the selling pressure continues, the XRP price variation may create a new monthly low. At the moment, the signal lines of MACD are crossing into the negative side; we may continue to see a negative move in the market as much as the coin continues to trade below the moving averages.
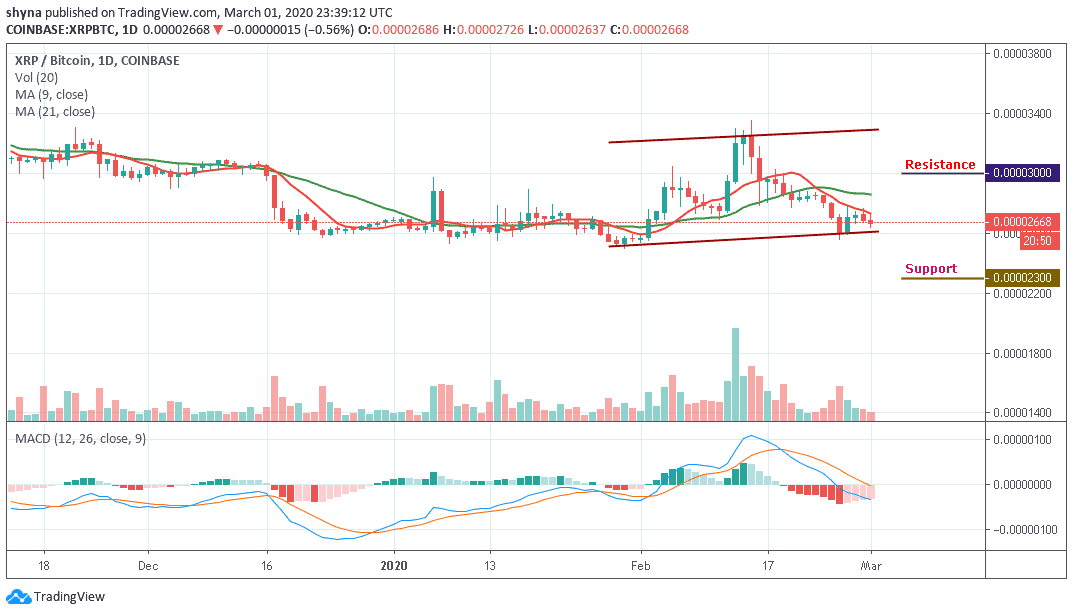
As the daily chart reveals, XRP/BTC is currently moving at 2668 SAT which is around the lower boundary of the channel. We may expect close support at the 2400 SAT before breaking to 2300 SAT and critically 2200 SAT levels. Should in case a bullish movement occurs and validates a break above the moving averages; we can then confirm a bull-run for the market and the nearest resistance levels to reach lies at 3000 SAT and above.
Please note: Insidebitcoins.com is not a financial advisor. Do your research before investing your funds in any financial asset or presented product or event. We are not responsible for your investing results.
Join Our Telegram channel to stay up to date on breaking news coverage