
Join Our Telegram channel to stay up to date on breaking news coverage
The Quant price prediction could set a bullish run if the buyers can push the coin above the resistance level of $115.
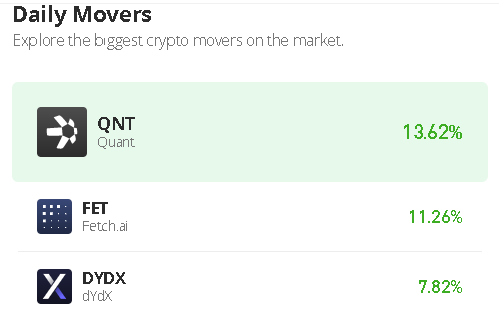
Quant Prediction Statistics Data:
- Quant price now – $0.112
- Quant market cap – $1.3 billion
- Quant circulating supply – 12 million
- Quant total supply – 14.6 million
- Quant Coinmarketcap ranking – #41
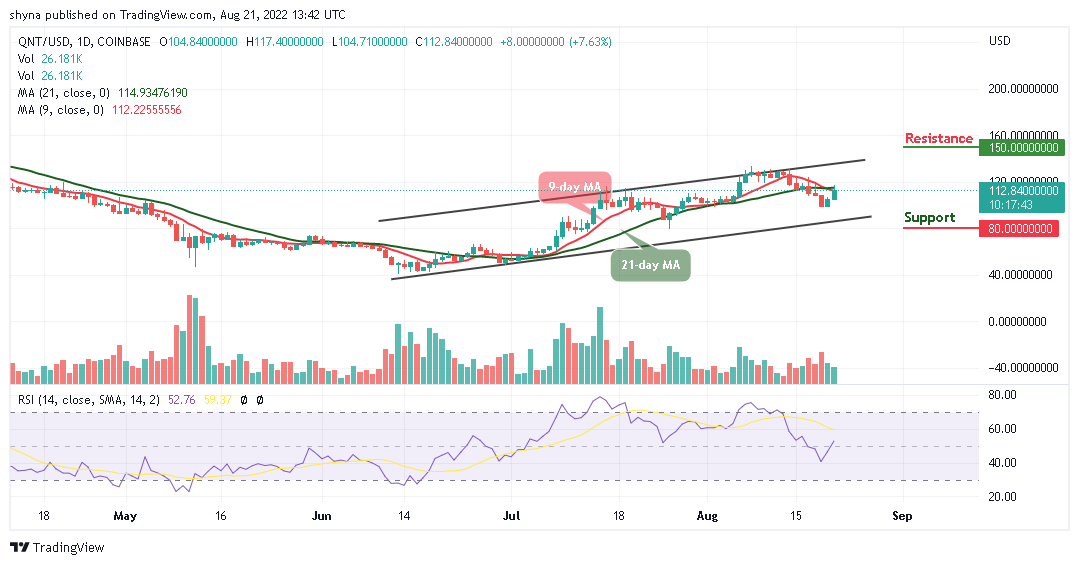
QNT/USD Market
Key Levels:
Resistance levels: $150, $160, $170
Support levels: $80, $70, $60
Your capital is at risk
QNT/USD is running a retracement move above $110 with a price growth of 7.63%. For the fact that the coin is recording some gain, the Quant price may follow a sideways movement within the channel if the coin crosses above the 9-day and 21-day moving averages and head towards the upper boundary of the channel. Meanwhile, traders can expect the price to continue to rise if the bulls put more pressure on the market.
QNT Heads to the Upside as Tamadoge (TAMA) Goes Bullish
The Quant price is on its way to crossing above the 9-day and 21-day moving averages at around $112. If the price continues to create a bullish movement, traders can then expect a bullish continuation towards the upside. Meanwhile, as the technical indicator Relative Strength Index (14) crosses above the 50-level, the possible resistance levels could be found at $150, $160, and $170 in the long term.
However, if the coin keeps the bullish movement for the next couple of days, traders may witness more of it reach higher levels. Meanwhile, the Quant price is trying to create a bullish movement in the short term. On the contrary, any bearish movement below the lower boundary of the channel could roll the coin back to the long-term support at $80, $70, and $60 levels.
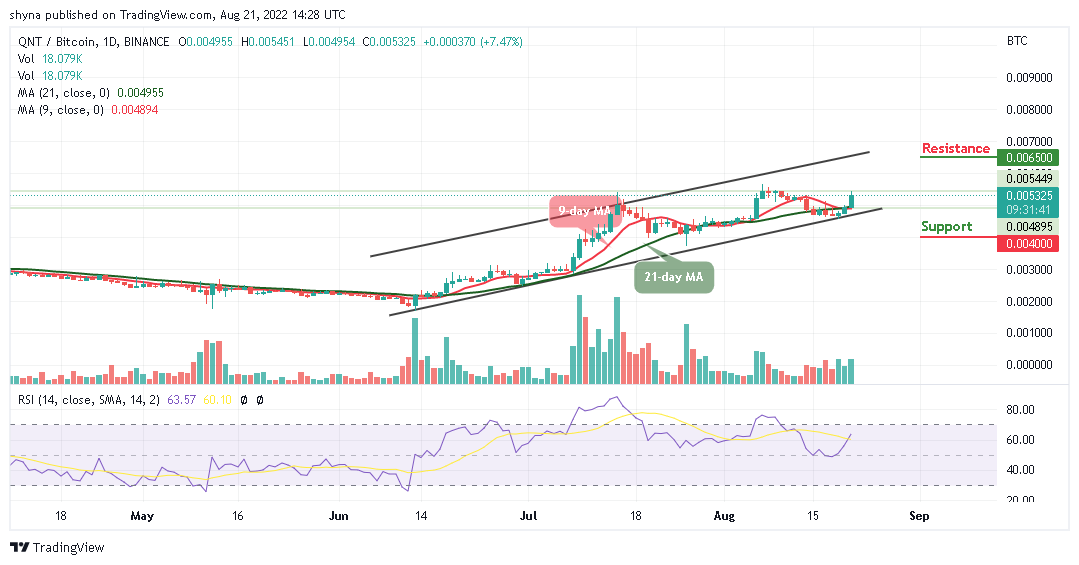
Against Bitcoin, the Quant price is hovering above the 9-day and 21-day moving averages. According to the daily chart, there is a need for an increasing volume and resistance to cause an upsurge in the market so that the coin can head towards the upper boundary of the channel. At the moment, Quant (QNT) is trading around 5325 SAT, traders can expect close support at 4000 SAT and below.
In the other words, if a bullish move pushes the price across the channel; traders can then confirm a bull run for the coin, and the potential resistance could be located at 6500 SAT and above. The technical indicator Relative Strength Index (14) is crossing above the 60-level, suggesting a bullish movement.
The Tamadoge team is celebrating the notable success of the presale by launching a $100,000 giveaway. There are multiple ways that people can participate in the prize pool. However, the requirement for those who want to participate in the prize pool is to hold a minimum of $100 worth of TAMA tokens on the day of the draw.
Related:
Join Our Telegram channel to stay up to date on breaking news coverage