
Join Our Telegram channel to stay up to date on breaking news coverage
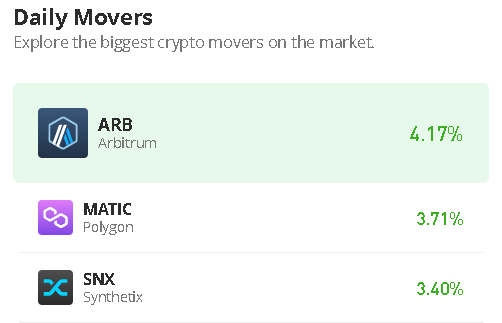
The Polygon price prediction is likely to break above the channel as the coin moves to create additional gains.
Polygon Prediction Statistics Data:
- Polygon price now – $0.92
- Polygon market cap – $8.6 billion
- Polygon circulating supply – $9.2 billion
- Polygon total supply – $10 billion
- Polygon Coinmarketcap ranking – #9
MATIC/USD Market
Key Levels:
Resistance levels: $1.10, $1.12, $1.14
Support levels: $0.72, $0.62, $0.52
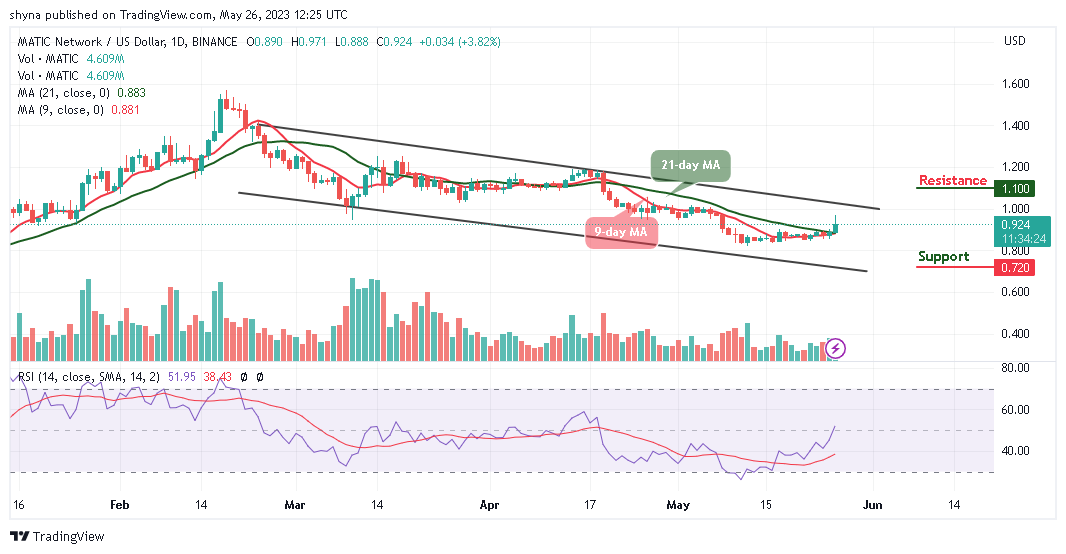
MATIC/USD is refreshing to a new high currently trading at $0.92 with a bullish crossover above the 9-day and 21-day moving averages. On the other hand, the bears may likely set in if the market price slides below the moving averages but the bulls may collect more on the price dips.
Polygon Price Prediction: MATIC Price Ready to Push Higher
The Polygon price can continue with the uptrend if the current market movement crosses above the upper boundary of the channel. Currently, the technical indicator Relative Strength Index (14) crosses above the 50-level by sending bullish signals into the market which could encourage more buyers to enter the market. However, the Polygon (MATIC) may now cross above the upper boundary of the channel to gain additional bullish movements.
However, if the red line of the 9-day MA crosses above the green line of the 21-day MA, the coin may continue to do well, and the Polygon price hit the resistance levels at $1.10, $1.12, and $1.14 respectively. In other words, if the coin decides to make a quick turn to the downside, there may be a quick bearish drop which could roll the market back to the critical supports at $0.72, $0.62, and $0.52.
Against Bitcoin, the Polygon price is hovering above the 9-day and 21-day moving averages as the price hovers at 3480 SAT. Meanwhile, the technical indicator Relative Strength Index (14) may cross above the 60-level if the bulls put in more effort. Moreover, for the fact that the 9-day MA crosses above the 21-day MA, the market price may remain on the upside.
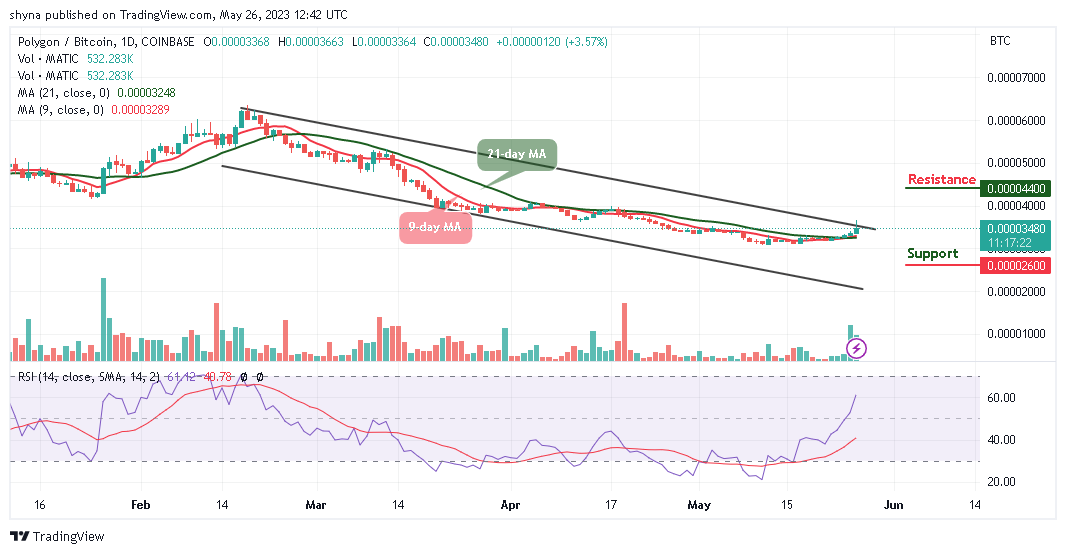
Moreover, the daily chart reveals that the potential resistance level is located at 4400 SAT and above, but a lower sustainable move may cancel the bullish pattern and attract new sellers coming into the market with the next focus on the support level of 2600 SAT and below.
Alternatives to Polygon
The Polygon price is in the hands of the bulls as the coin moves to cross above the upper boundary of the channel. However, due to a lack of buying power, the bulls may need to gather enough energy to push the coin to the upside. The technical indicator Relative Strength Index (14) is moving above the 50-level with the signal line pointing to the north, suggesting bullish movement. Nevertheless, AiDoge (AI) token is taking things to the next level by automating the meme generation process. Each generation is exclusive from the next, this alleviates the issue of the same memes circulating the internet time and time again. Meanwhile, during the AiDoge presale today, almost $12 million has already been raised.
Join Our Telegram channel to stay up to date on breaking news coverage