Join Our Telegram channel to stay up to date on breaking news coverage
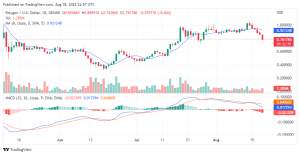
In early July, bulls were in control of the market and they took the price of MATIC/USD from $0.4883842 to $0.965928 by the middle of the month. Between the 4th of July to the 19th of July, the coin had appreciated by 97.8%. After this, the bears came back and this made the market range for a while. The bulls could not hold up against them for too long as they were losing strength. Now the bears have taken the price of the market back down to $0.784010. This was the support level price on the 4th of July.
Polygon Price Statistic Data:
- MATIC/USD price now: $0.7847
- MATIC/USD market cap: $6,308,379,230
- MATIC/USD circulating supply: 8.04 Billion MATIC
- MATIC/USD total supply: 10,000,000,000 MATIC
- MATIC/USD coin market ranking: #15
Key Levels
- Resistance: $0.959751, $0.938978, $1.025533
- Support: $0.779715, $0.765867, $0.5326529
Your capital is at risk
Polygon Price Analysis: MATIC/USD Bears Are in Control
After the market went in favour of the bulls for a while, bears have finally taken hold of control of the market. The three consecutive bearish moves in the market are an indication of bullish weakness after the period of a tug-of-war with the bears. The candlesticks were not as strong, but it may be due to the weakness in the buying pressure.
Polygon Price Analysis: Information From the Indicators
On the 16th of August, the price action crossed over to the lower side of the 9-day moving average curve. This signals that the trend is switching to a downtrend. The candlesticks that followed were bearish (although they were not two strong). The bulls are not relegated yet. Their bullish force can still be felt. It is just that bears are a bit stronger. On the MACD indicator, the negative histogram is a sign that the market is favoring the bears. The faster moving average has crossed the slower moving average with a difference of -0.023309.
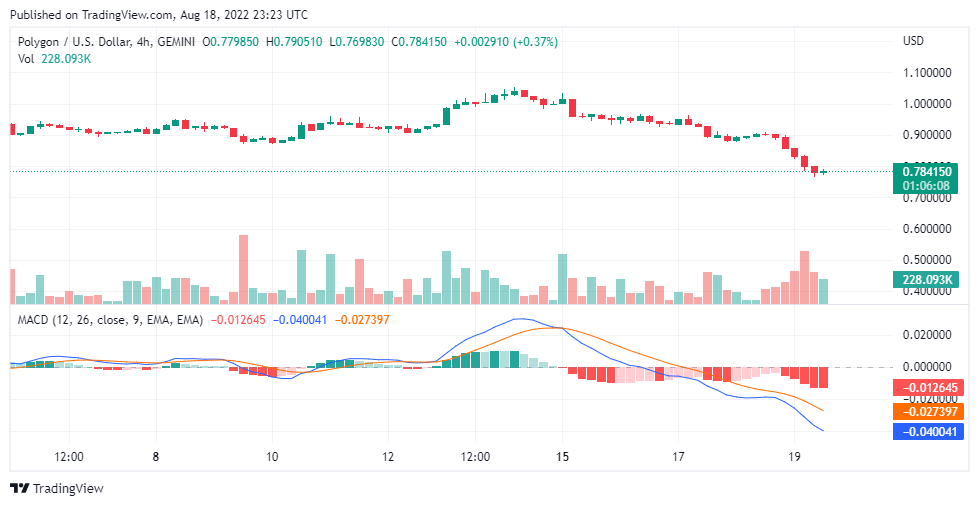
Polygon Price Analysis: MATIC/USD 4-Hour Chart Point of View
From the 4-hour chart, we can see the bears dominating the first three sessions of the day. And then there is a very weak bullish force which was met with a strong bearish force. This is creating a deadlock between the two forces in the fourth trading session. On the MACD, we can see strong bullish activities. Because of this, my conclusion is that the market may still trend down more.
Related
Join Our Telegram channel to stay up to date on breaking news coverage