
Join Our Telegram channel to stay up to date on breaking news coverage
Bulls dominate Polygon market
Polygon (MATICUSD) Price Analysis – October 07
More pressure from buyers will break up the resistance level of $0.90, this may increase the price to $1.01 and $1.18 resistance levels. In case sellers acquire more pressure, Polygon price may reduce to the support level of $0.74 and the support level of $0.64.
Key Levels:
Resistance levels: $0.90, $1.01, $1.18
Support levels: $0.74, $0.64, $0.47
MATIC/USD Long-term Trend: Bullish
On the Long-term outlook, MATIC/USD price is on the bullish trend. The coin was on the bearish trend last week. Sellers took over the market on September 13 at $0.90 resistance level with the formation of bearish engulfing candle. MATIC decreased below $0.74 support level. Bulls gained more momentum and returns price towards previous high at $0.90 level. At the moment bulls are actively controlling polygon market.
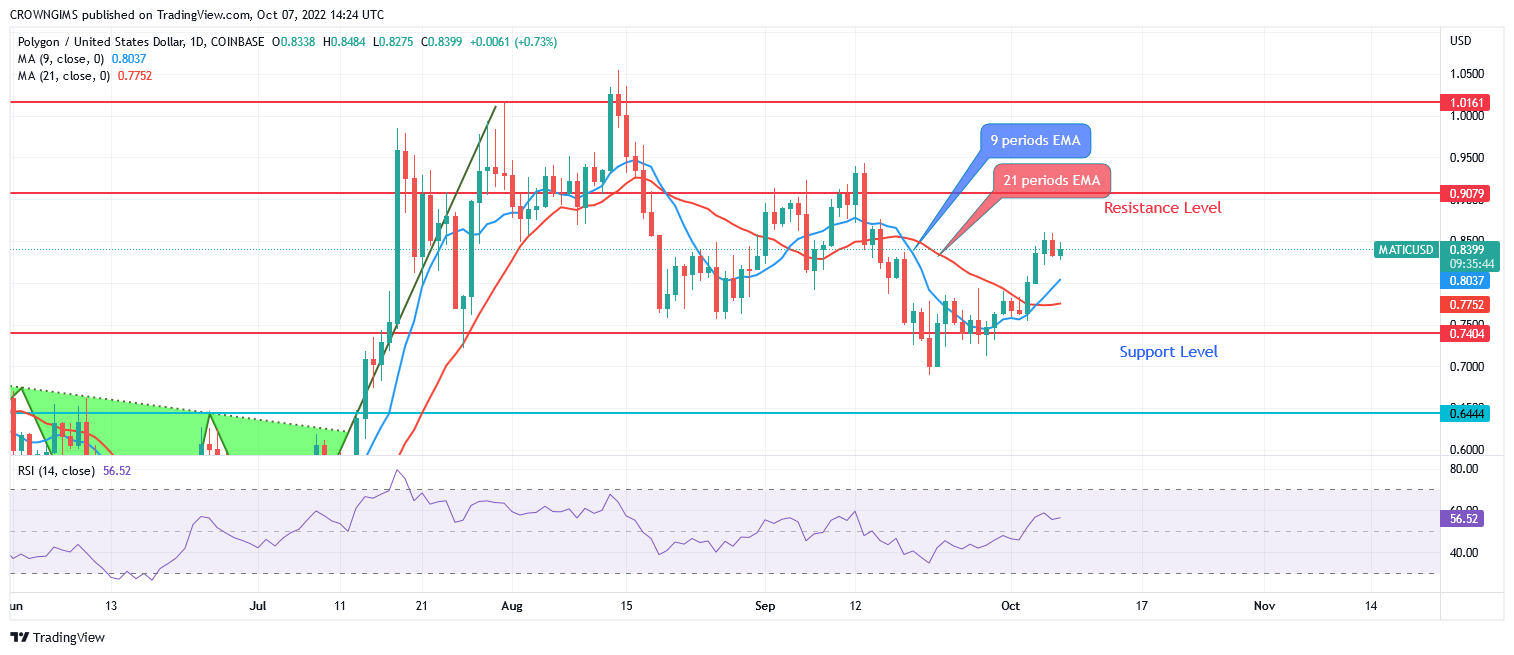
Polygon is trading above the 9 periods EMA and 21 periods EMA with the later above former. More pressure from buyers will break up the resistance level of $0.90, this may increase the price to $1.01 and $1.18 resistance levels. In case sellers acquire more pressure, MATIC price may reduce to the support level of $0.74 and the support level of $0.64.
Your capital is at risk
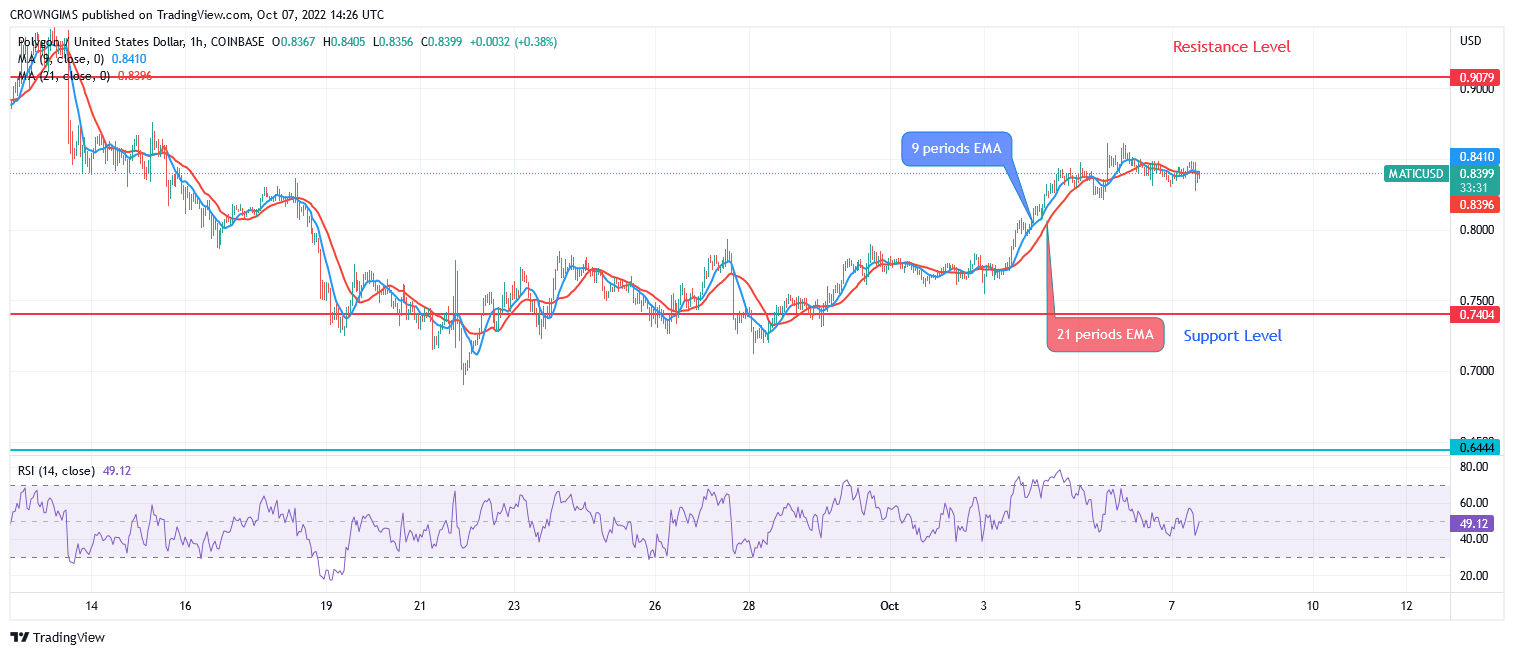
MATIC/USD Short-term Trend: Bullish
Polygon is bullish on the medium-term outlook. Sellers were able to push the price to the support level of $0.74. Bulls successfully defended the just mentioned support level. MATIC price increases with the formation of more bullish candles. Price is increasing towards the resistance level of $0.90.
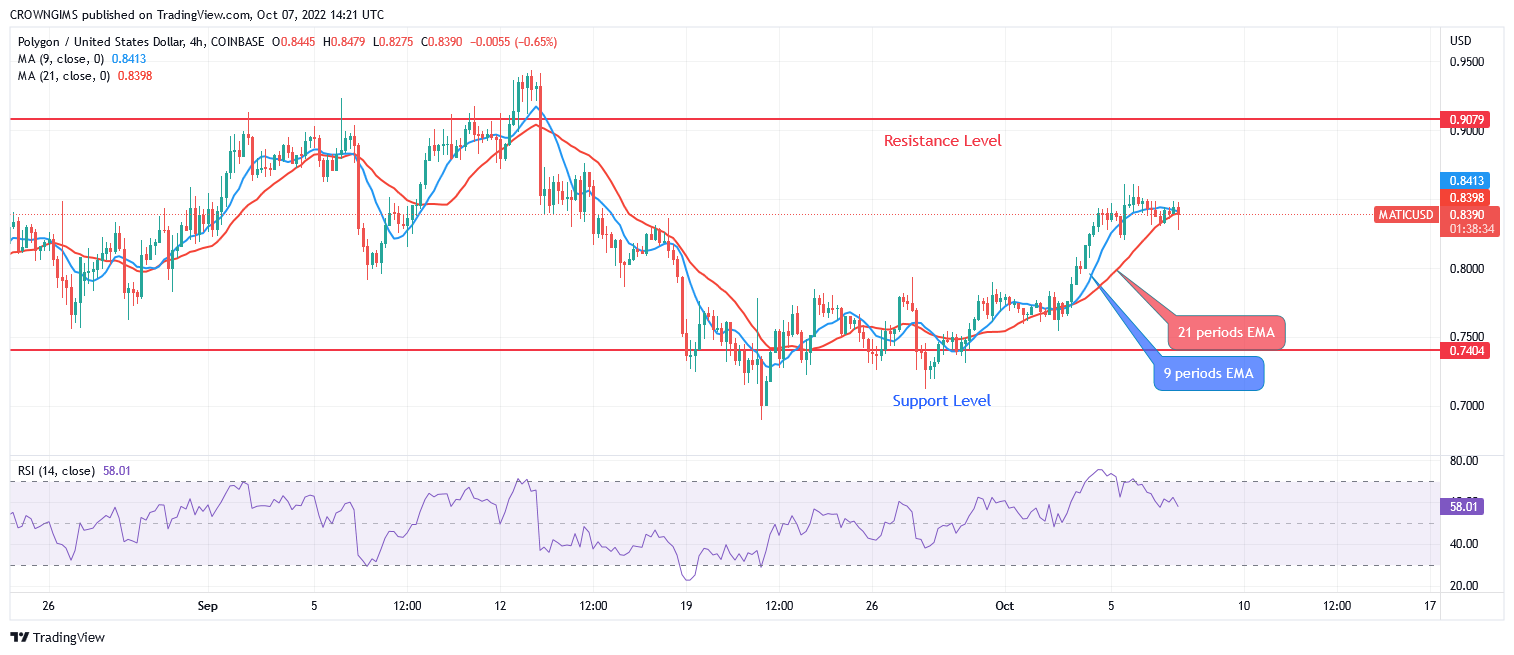
The Polygon price is trading above the two EMAs with close distance between them which indicates a bullish trend. The 9-day EMA is above the 21 periods EMA. The relative strength index period 14 is at 59 levels with the signal line pointing down to connote sell signal.
Join Our Telegram channel to stay up to date on breaking news coverage