Join Our Telegram channel to stay up to date on breaking news coverage
DOT/USD price action lacks both direction and momentum. Mostly this crypto’s price has stayed under $6.50 versus the US dollar. However, technical indicators are still portraying some signs which should be examined to gain further insight into price movements in this market. Also, our study will as well be extended to the DOT/BTC market, for the sake of traders in that market.
DOT Analysis Statistics Data:
Polkadot value now: $6.07
Polkadot market cap: $6.71 billion
DOT moving supply: 1.13 billion
The Total supply of DOT: 1.24 billion
Polkadot’s Coinmarketcap ranking: #12
Crucial Price Levels:
Resistance: $6.20, $6.45, $6.75
Support: $6.07, $5.90, $5.70
Polkadot Price Prediction Today, October 21, 2022: DOT/USD Poised to Visit Lower Levels
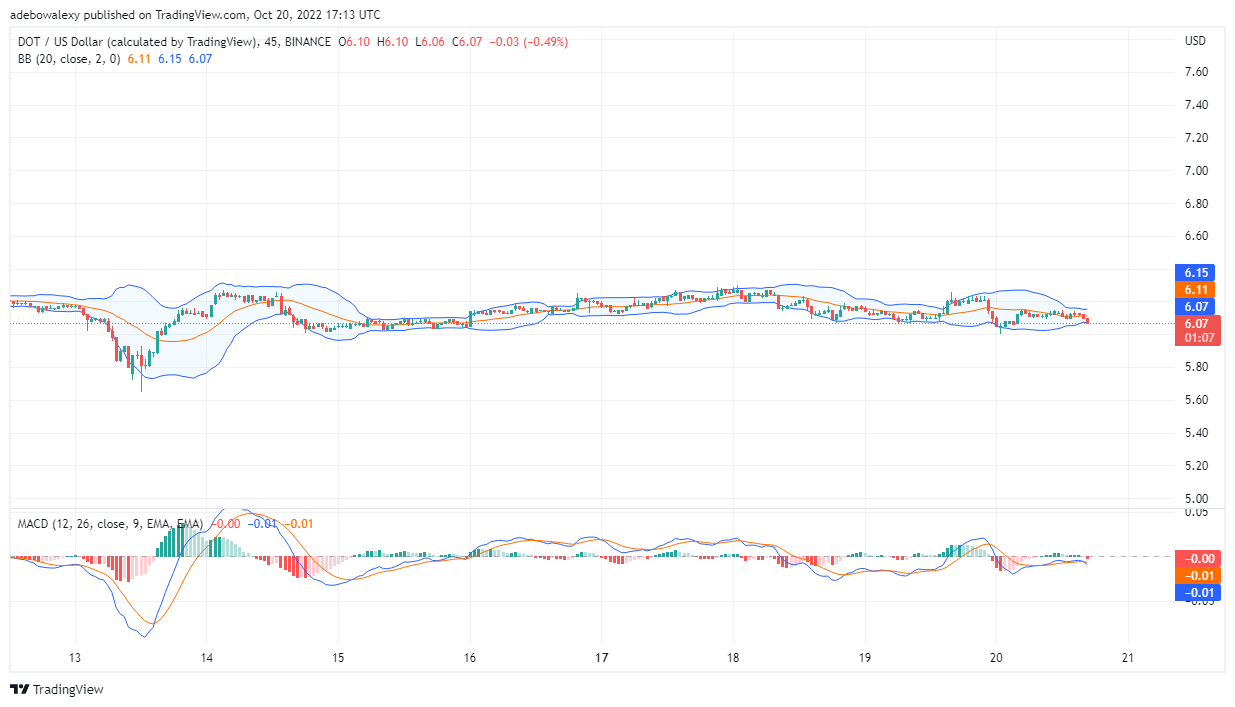
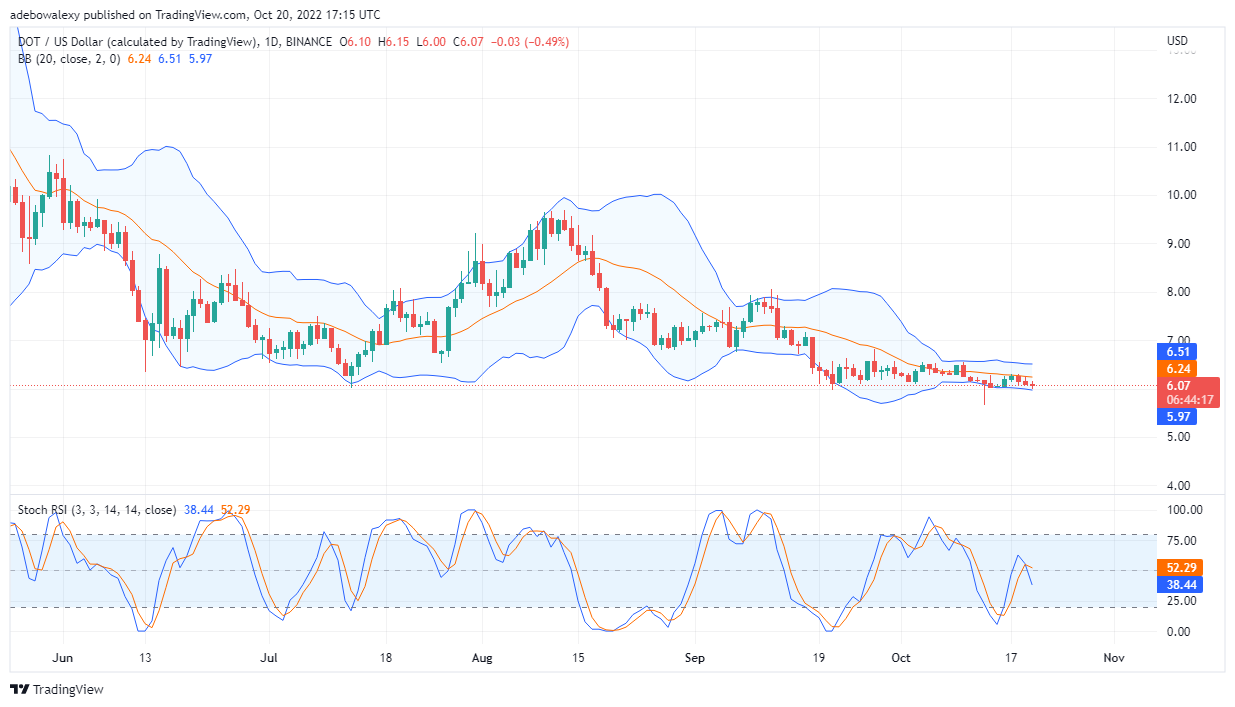
After DOT/USD movement tested the middle limit of the Bollinger band price action has bounced to the downside via three consecutive red candlesticks. By implication, this revealed that the bears have been winning for the past three trading sessions. Consequently, this has brought Polkadot’s price from around $6.51 to $6.07. Moving on it could be perceived that the Stochastic RSI curve performed a bearish crossover while it had barely surpassed the 50% mark. And from the looks of this Indicator, we can anticipate that price will fall below the support of $6.07.
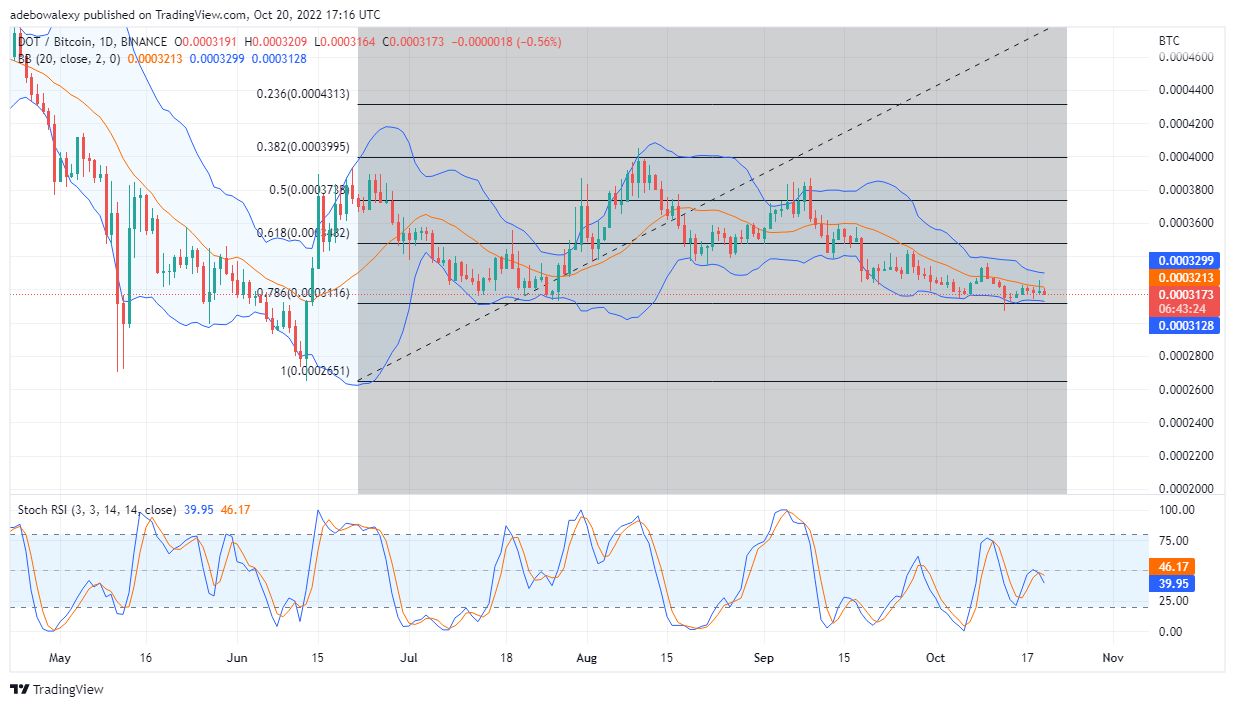
Polkadot Price Prediction Today, October 21, 2022: DOT/BTC on a Steady Downtrend
The movement of price on the DOT/BTC appears to be gently proceeding in the downward direction. Even at this point, it looks like price action will soon test the Fibonacci level of 78.60. Additionally, it could be observed that price activities in recent times remain under the MA line. Consequently, this portrays the dominance of sellers.
Now on the RSI, a bearish crossover occurred near the 50% level. Consequently, it seems that the price level 0.0003116 will be tested soon. At the same time, this level may be broken downside should there be a lack of buy orders at this level. Traders can buy the 0.0003116 level with the hope of an upside correction occurring here.
One great coin we recently reviewed is IMPT token, currently on the first stage of its presale and close to selling out that stage – having so far raised $6 million. Find out more at the link below
- Related
- How to Buy IMPT
Join Our Telegram channel to stay up to date on breaking news coverage