Join Our Telegram channel to stay up to date on breaking news coverage
Polkadot Price Prediction – May 28
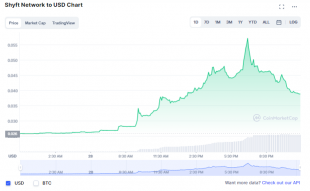
The DOT/USD market has been under depression as the crypto economy experiences a range in its pushes against the US Dollar over time. It has been gathered that price trades slightly above the $9 value line at a 2.18 percentage rate positive.
Polkadot (DOT) Statistics:
DOT price now – $9.89
DOT market cap – $9.7 billion
DOT circulating supply – 987.6 million
DOT total supply – 1.1 billion
Coinmarketcap ranking – #11
DOT/USD Market
Key Levels:
Resistance levels: $12, $14, $16
Support levels: $8, $6, 44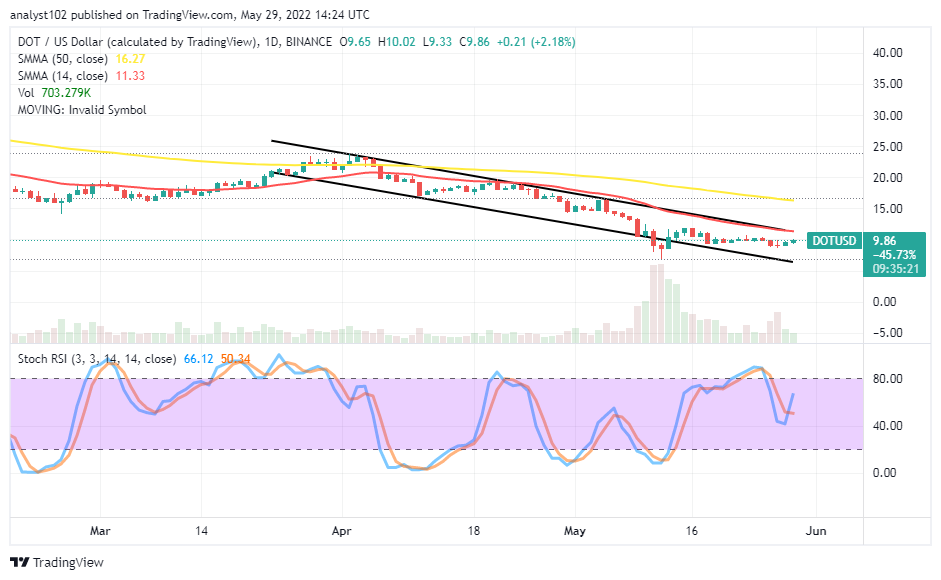 GMT/USD – Daily Chart
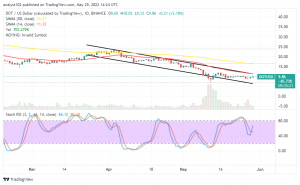
The daily chart reveals the DOT market activity against the US Dollar experiences a range within the bearish channel trend lines drawn. The 14-day SMA indicator trend southward is alongside the upper bearish trend line beneath the 50-day SMA trend line. About some days back, variant tiny lower highs almost at the same length as lower lows. The Stochastic Oscillators have moved southbound through some range lines. And they are trying to cross northbound from the range of 40.
Will the DOT/USD market price get resisted around the path of the 14-day SMA afterward?
As there has been no general validating opinion against the current bearish trending motion of most of the cryptos presently, the DOT/USD market may get resisted around the path of the 14-day SMA indicator. The path point lies in agreement with what is currently obtainable in the ranging outlook of the pairing trading instruments. Therefore, it won’t be technically ideal for long-position takers to rely on any possible spike around the smaller SMA trend line.
On the downside of the technical analysis, expectantly, the downward-trending motion in the DOT/USD market operations tends to enter a relaxation trading moment to allow some smaller pull-ups to emerge to get back the momentum in the bid of continuation. A tough resistance zone lies around the $15 level. The positioning of the Stochastic Oscillators portends the presumed scenario will play out in the volatile trading activities.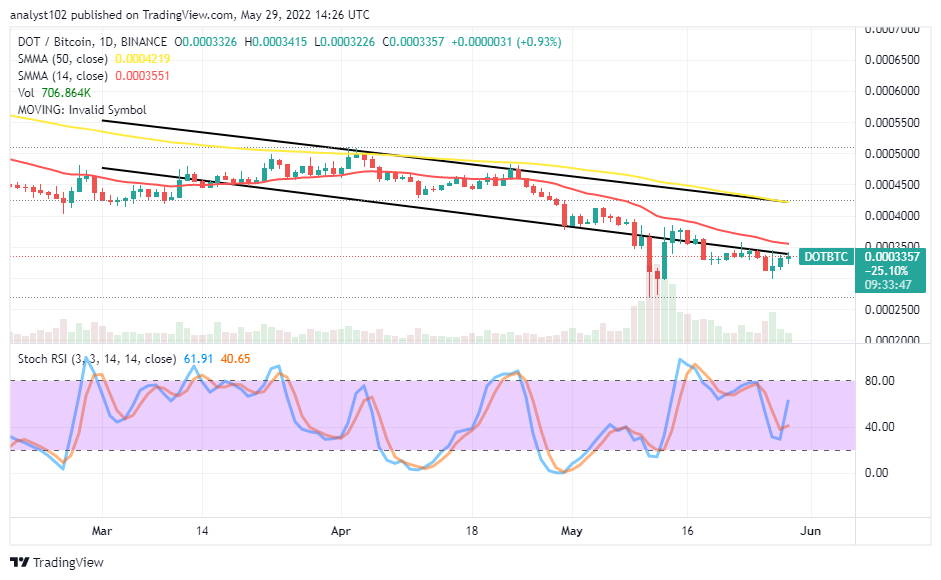
DOT/BTC Price Analysis
In comparison, Polkadot is striving to regain its stance against the pushing capability of Bitcoin. It also observes that the cryptocurrency pair price experiences a range beneath the trend lines of the SMAs. The 50-day SMA indicator is above the 14-day SMA indicator. The Stochastic Oscillators have crossed their lines northbound from the range of 40 to indicate the base crypto is struggling to push against its countering crypto. But, the counter crypto seems not to give a damn easily in the near time.
Read more:
Join Our Telegram channel to stay up to date on breaking news coverage